

Question: o 6. Table 1 and Table 2 below are the summary results from two tables examining the association between 1) an exposure variable and covariates
o
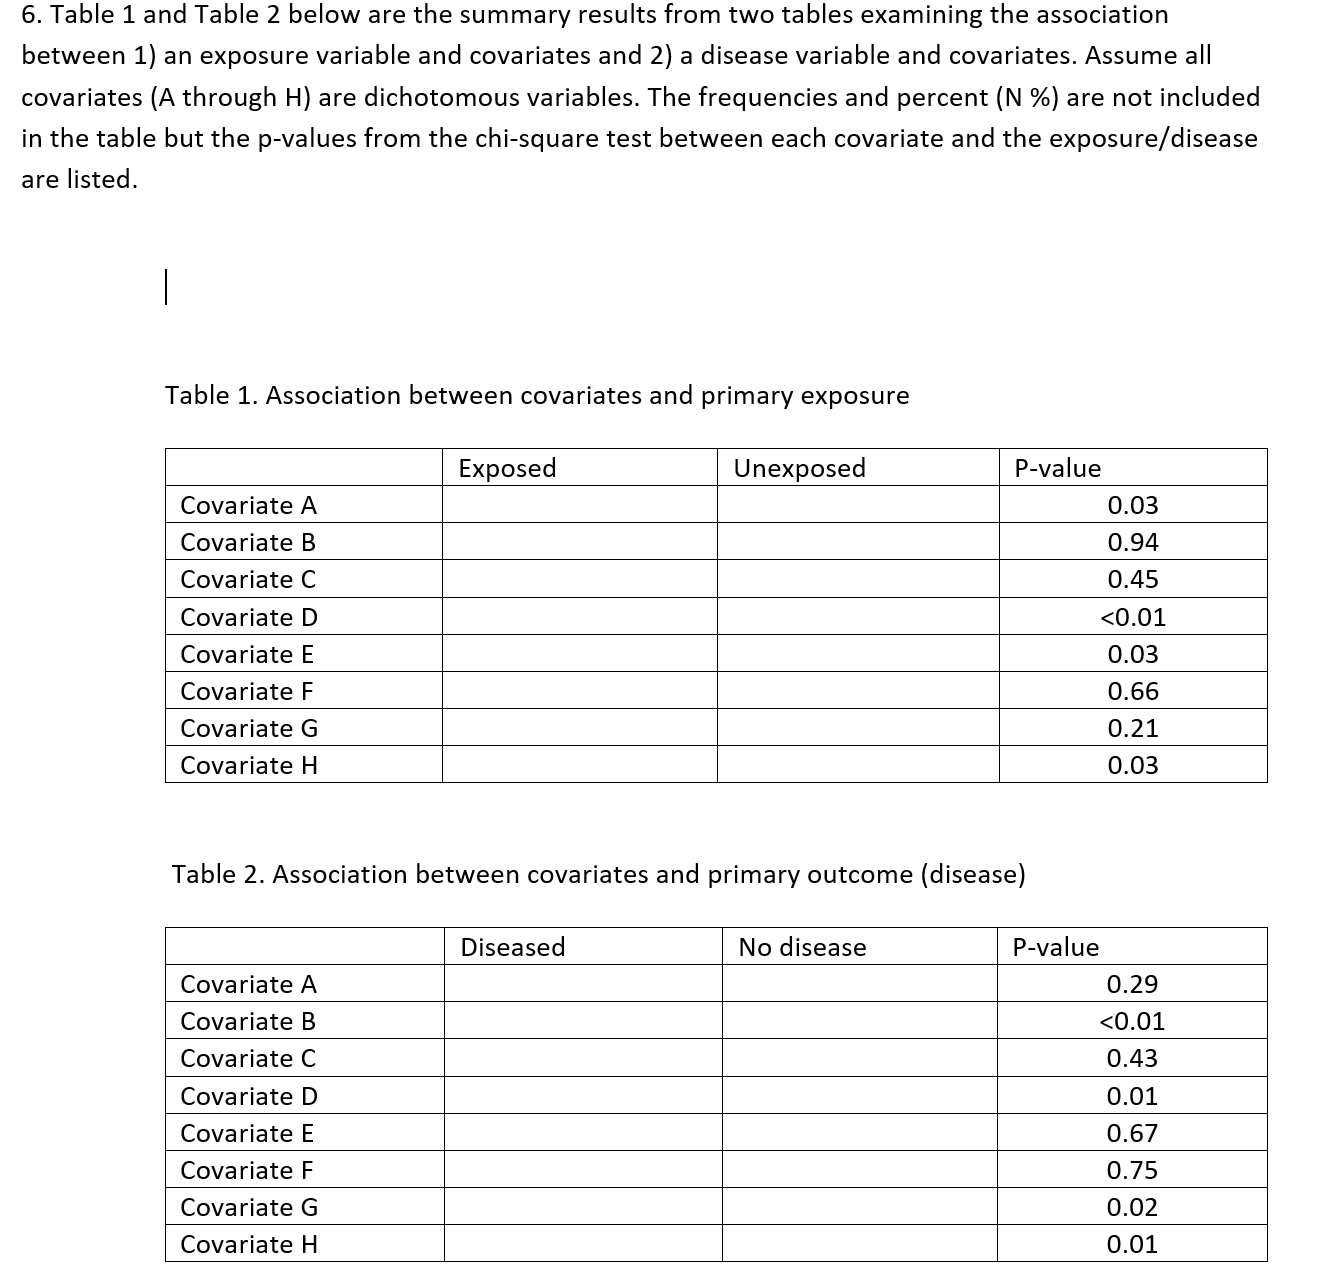
6. Table 1 and Table 2 below are the summary results from two tables examining the association between 1) an exposure variable and covariates and 2) a disease variable and covariates. Assume all covariates (A through H) are dichotomous variables. The frequencies and percent (N %) are not included in the table but the p-values from the chi-square test between each covariate and the exposure/disease are listed. Table 1. Association between covariates and primary exposure Exposed Unexposed P-value Covariate A 0.03 Covariate B 0.94 Covariate C 0.45 Covariate D
Step by Step Solution
There are 3 Steps involved in it
1 Expert Approved Answer
Step: 1 Unlock

Question Has Been Solved by an Expert!
Get step-by-step solutions from verified subject matter experts
Step: 2 Unlock
Step: 3 Unlock