

Question: O 8 D Question 11 3 pts Que Using the following statistics about a distribution of data, what is the interquartile range? Supp Minimum Observation

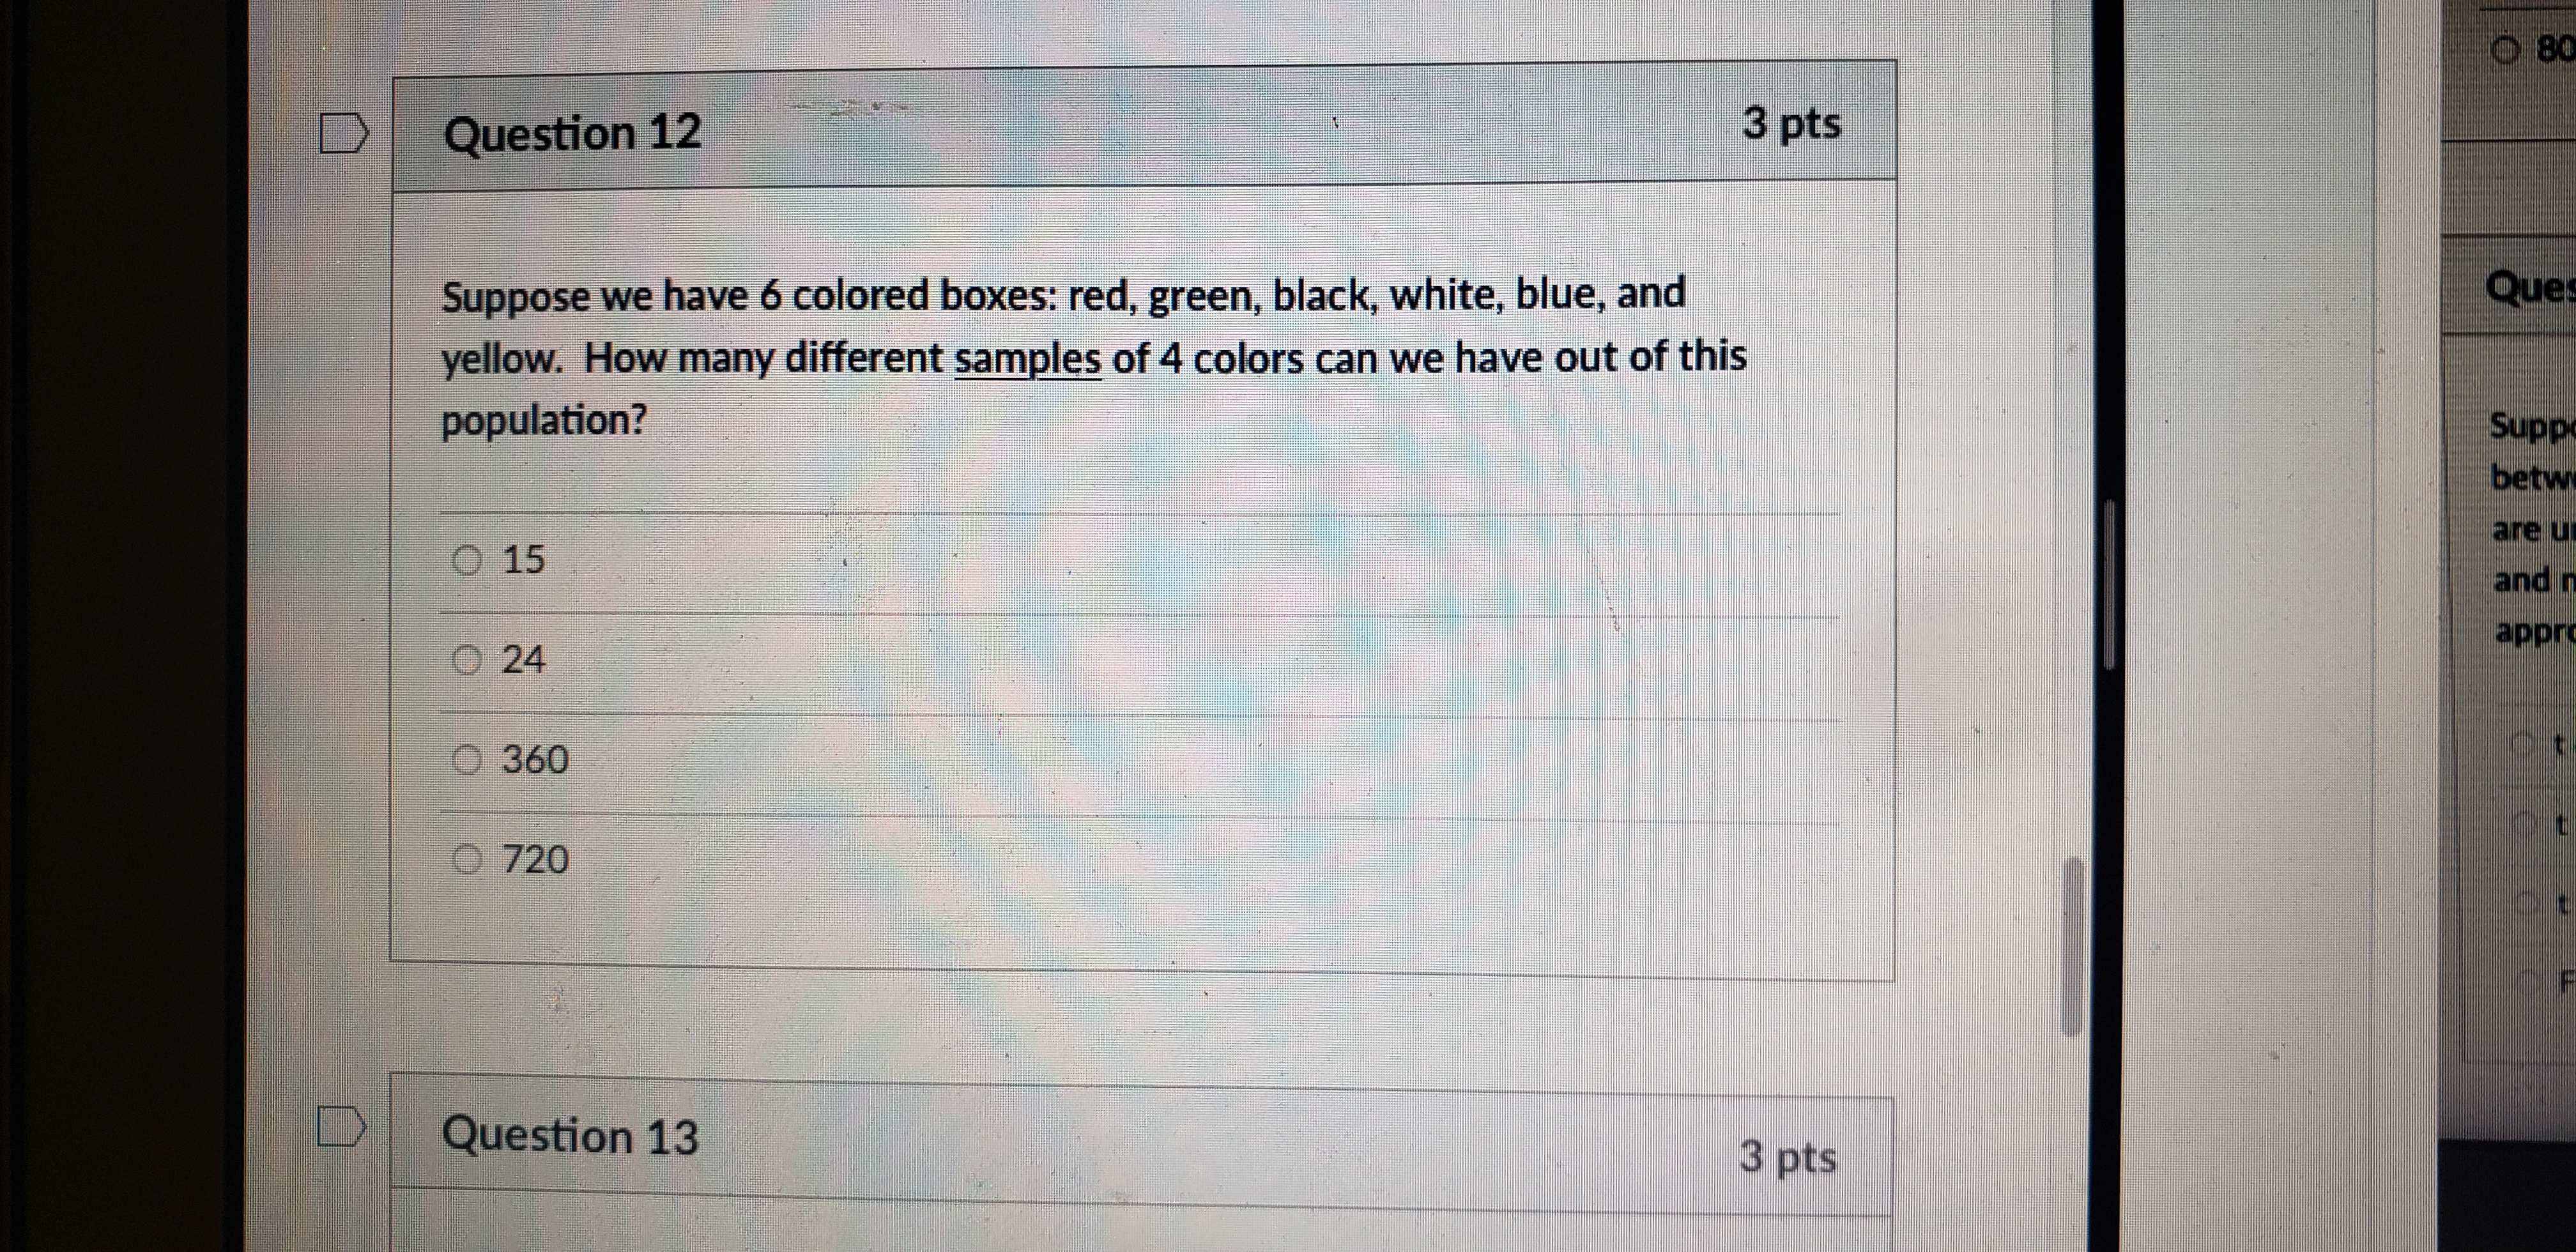


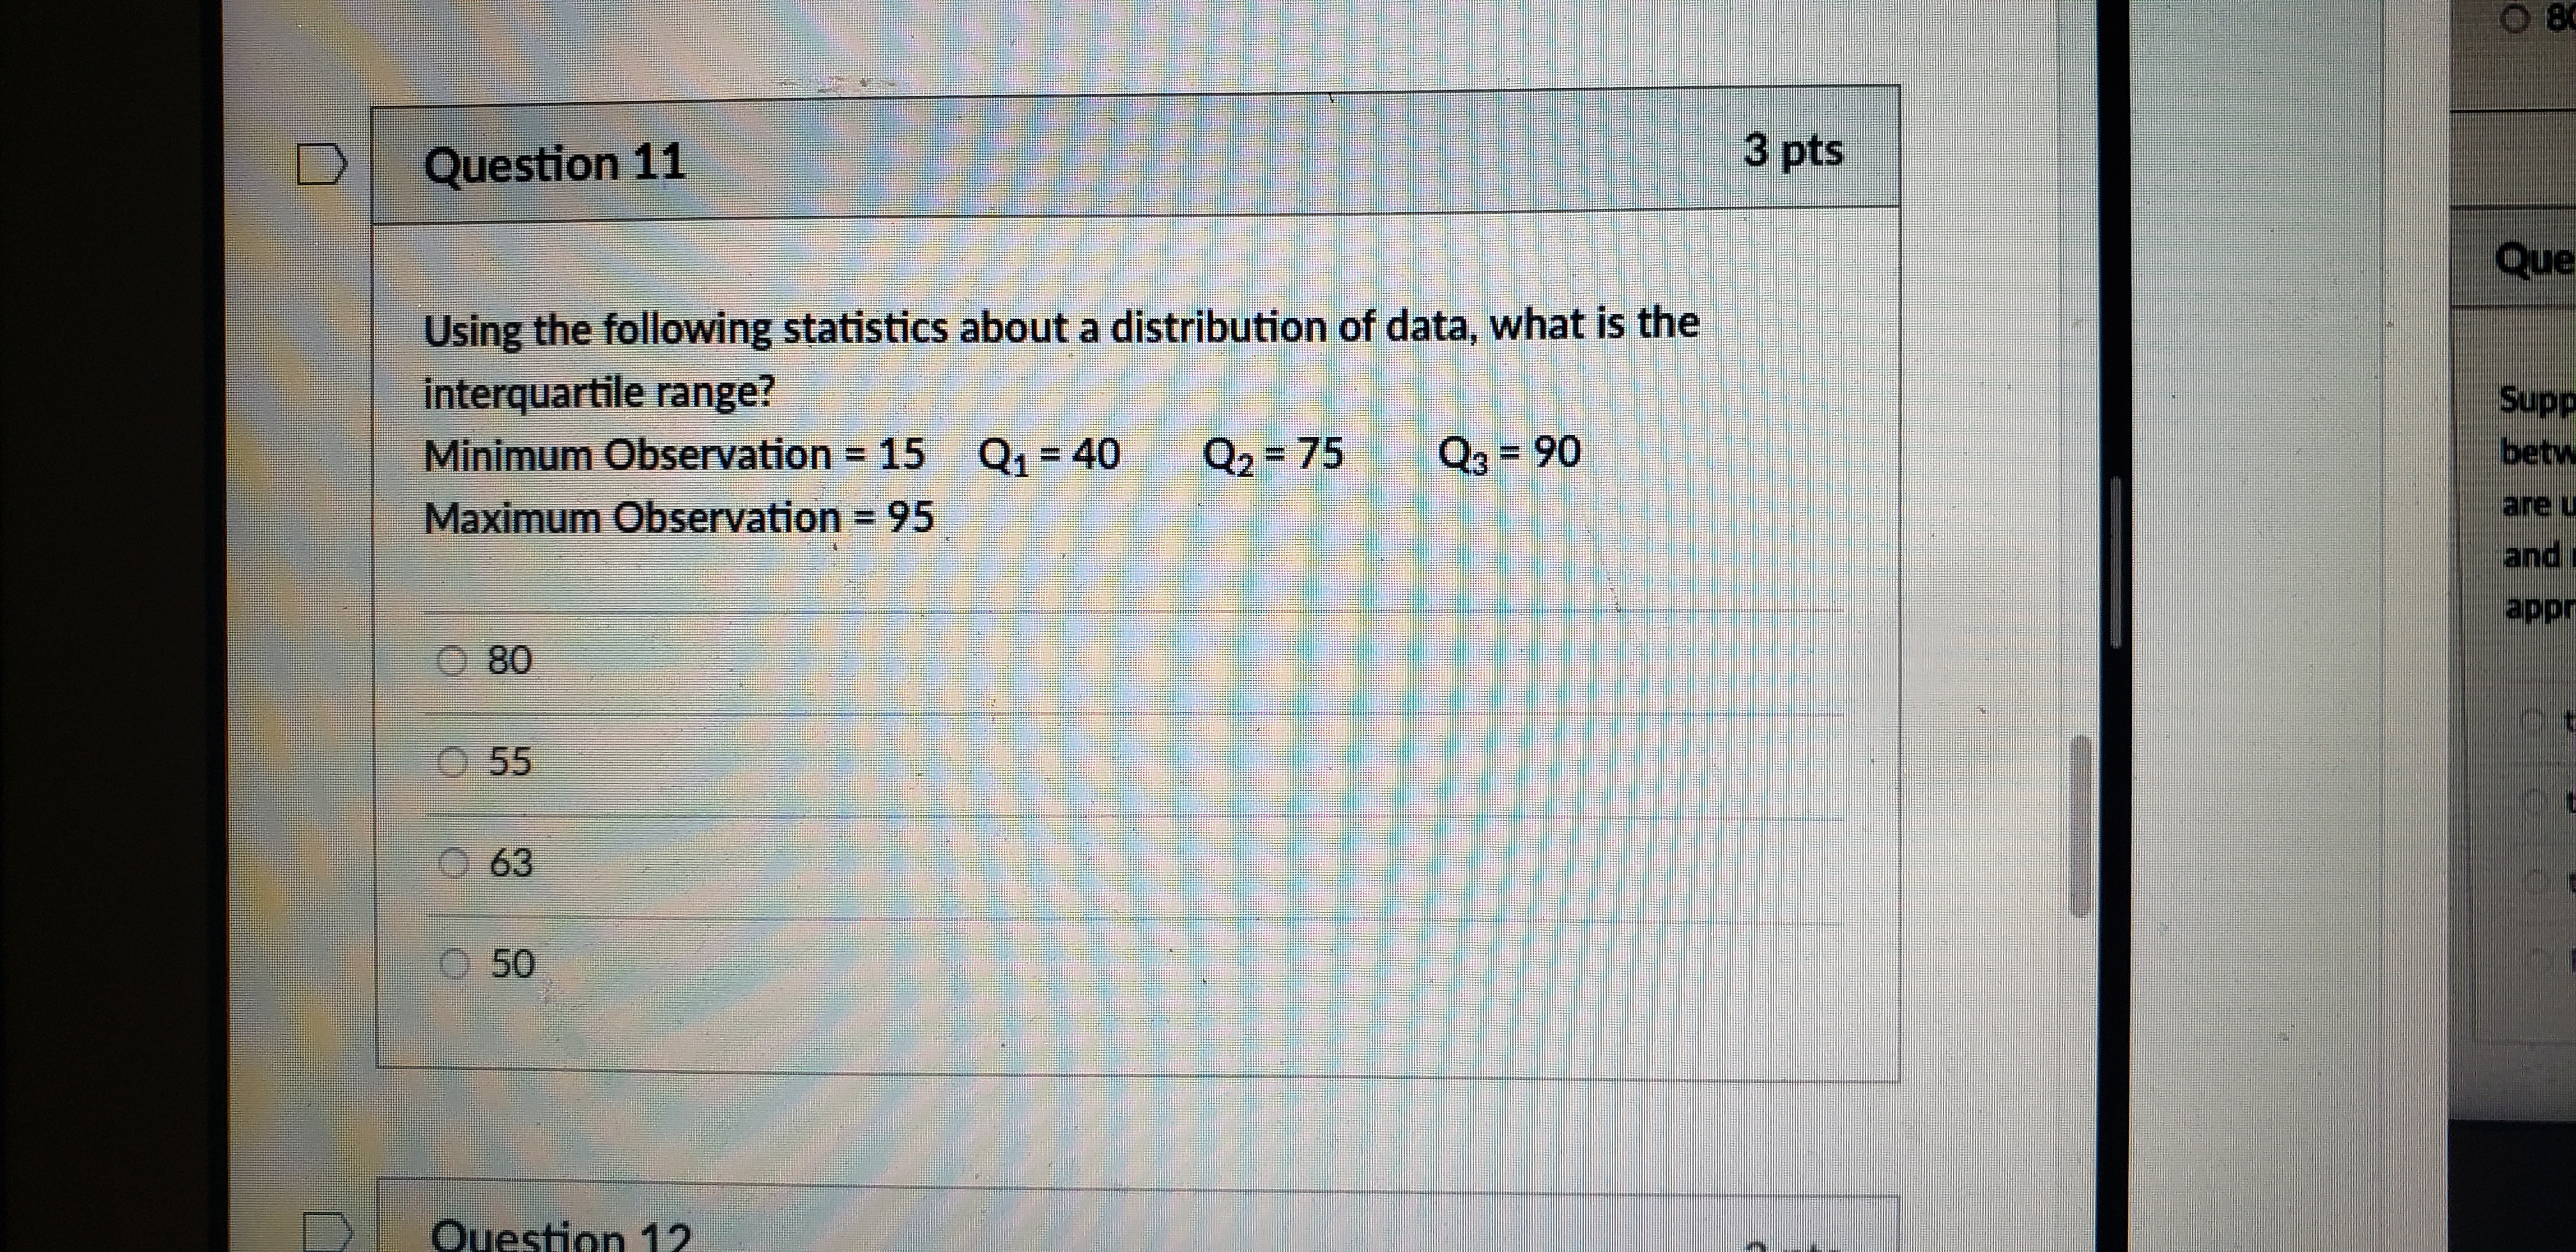

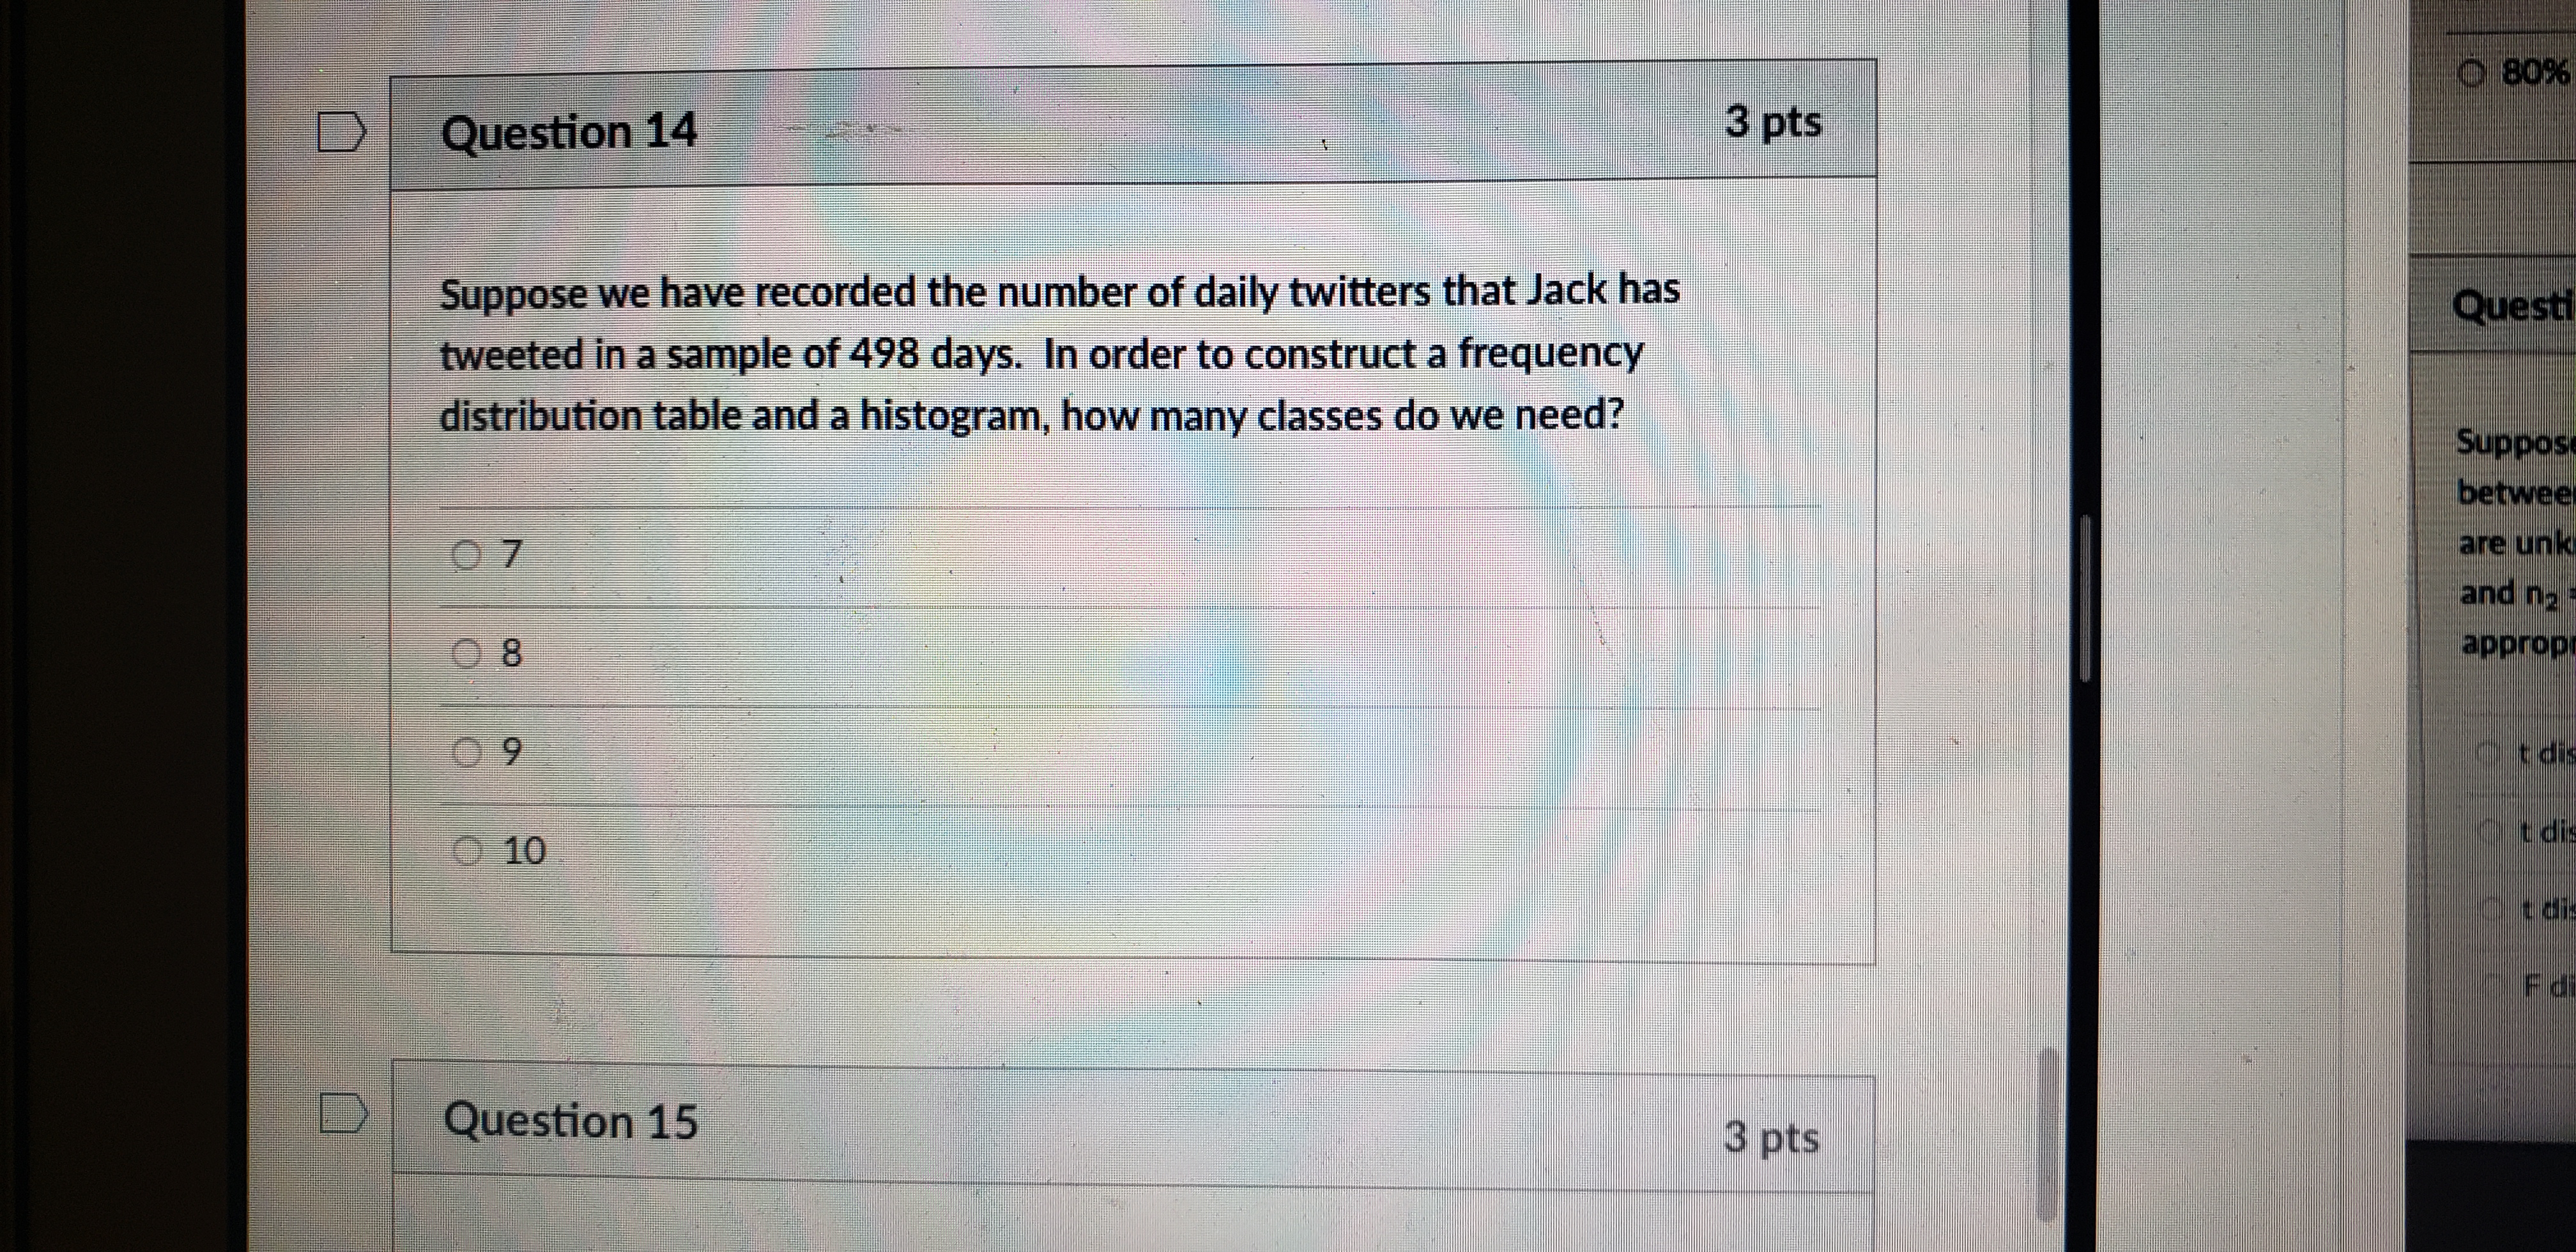
O 8 D Question 11 3 pts Que Using the following statistics about a distribution of data, what is the interquartile range? Supp Minimum Observation = 15 Q1 = 40 Q2 =75 Q3 = 90 betw Maximum Observation = 95 are and appr 80 O 55 0 63 50 Question 1280 Question 12 3 pts Suppose we have 6 colored boxes: red, green, black, white, blue, and Que yellow. How many different samples of 4 colors can we have out of this population? Supp betw O 15 are U and O 24 appr 360 720 DD Question 13 3 ptsD confuleno moves line for the propostion that him to sit frontof Question S 3 pes80% Question 14 3 pts Suppose we have recorded the number of daily twitters that Jack has Questi tweeted in a sample of 498 days. In order to construct a frequency distribution table and a histogram, how many classes do we need? Suppos betwee 07 are unk and na 0 8 approp 09 10 Fd Question 15 3 pts
Step by Step Solution
There are 3 Steps involved in it

Get step-by-step solutions from verified subject matter experts