

Question: O Business Statistics SP1 2023 nework Assignment 6 Two Sample Hypothesis ting Upda on list stion 1 stion 2 stion 3 K Que The accompanying
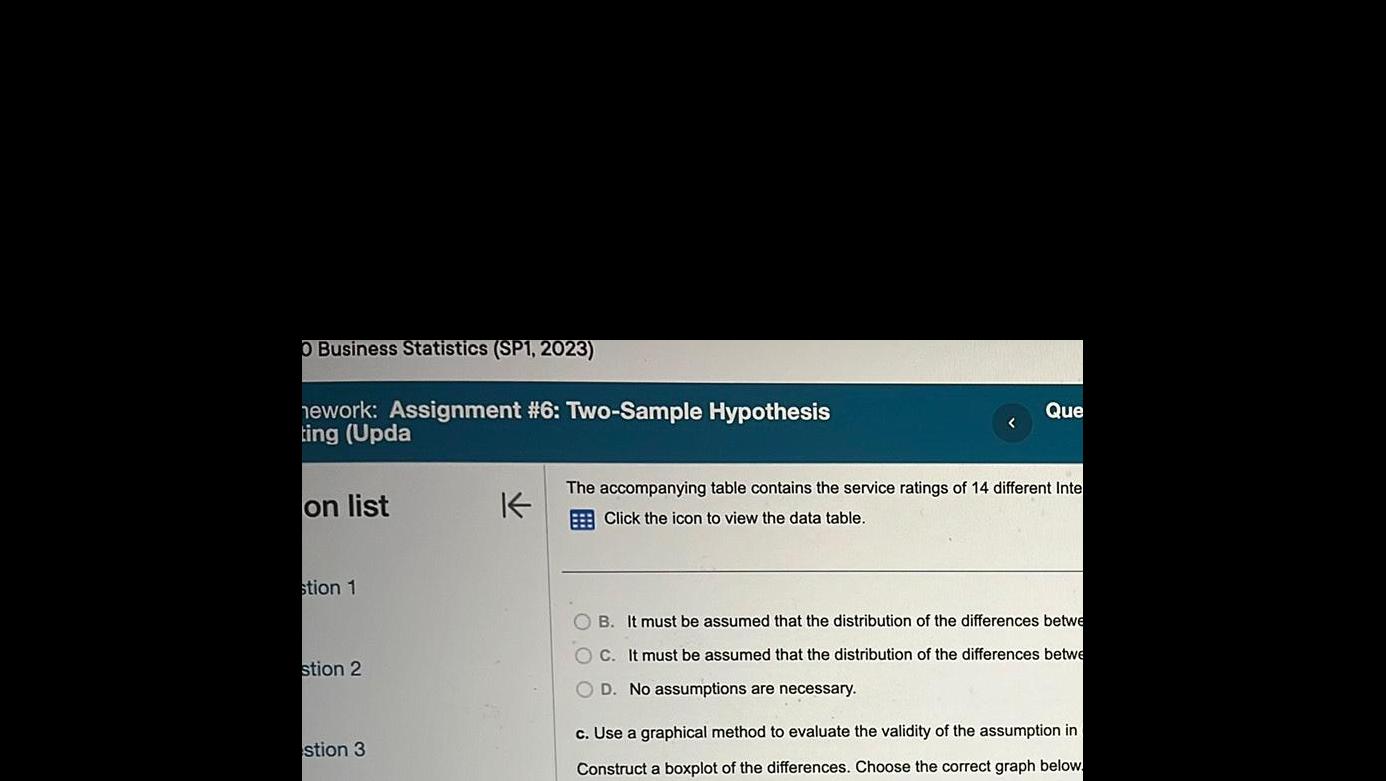

O Business Statistics SP1 2023 nework Assignment 6 Two Sample Hypothesis ting Upda on list stion 1 stion 2 stion 3 K Que The accompanying table contains the service ratings of 14 different Inte Click the icon to view the data table B It must be assumed that the distribution of the differences betwe OC It must be assumed that the distribution of the differences betwe OD No assumptions are necessary c Use a graphical method to evaluate the validity of the assumption in Construct a boxplot of the differences Choose the correct graph below
Step by Step Solution
There are 3 Steps involved in it
1 Expert Approved Answer
Step: 1 Unlock

Question Has Been Solved by an Expert!
Get step-by-step solutions from verified subject matter experts
Step: 2 Unlock
Step: 3 Unlock