

Question: O c. DV - Final Grade, IV - Study Hours, r = 0.79 O d. DV = Final Grade; IV = Study Hours; r =
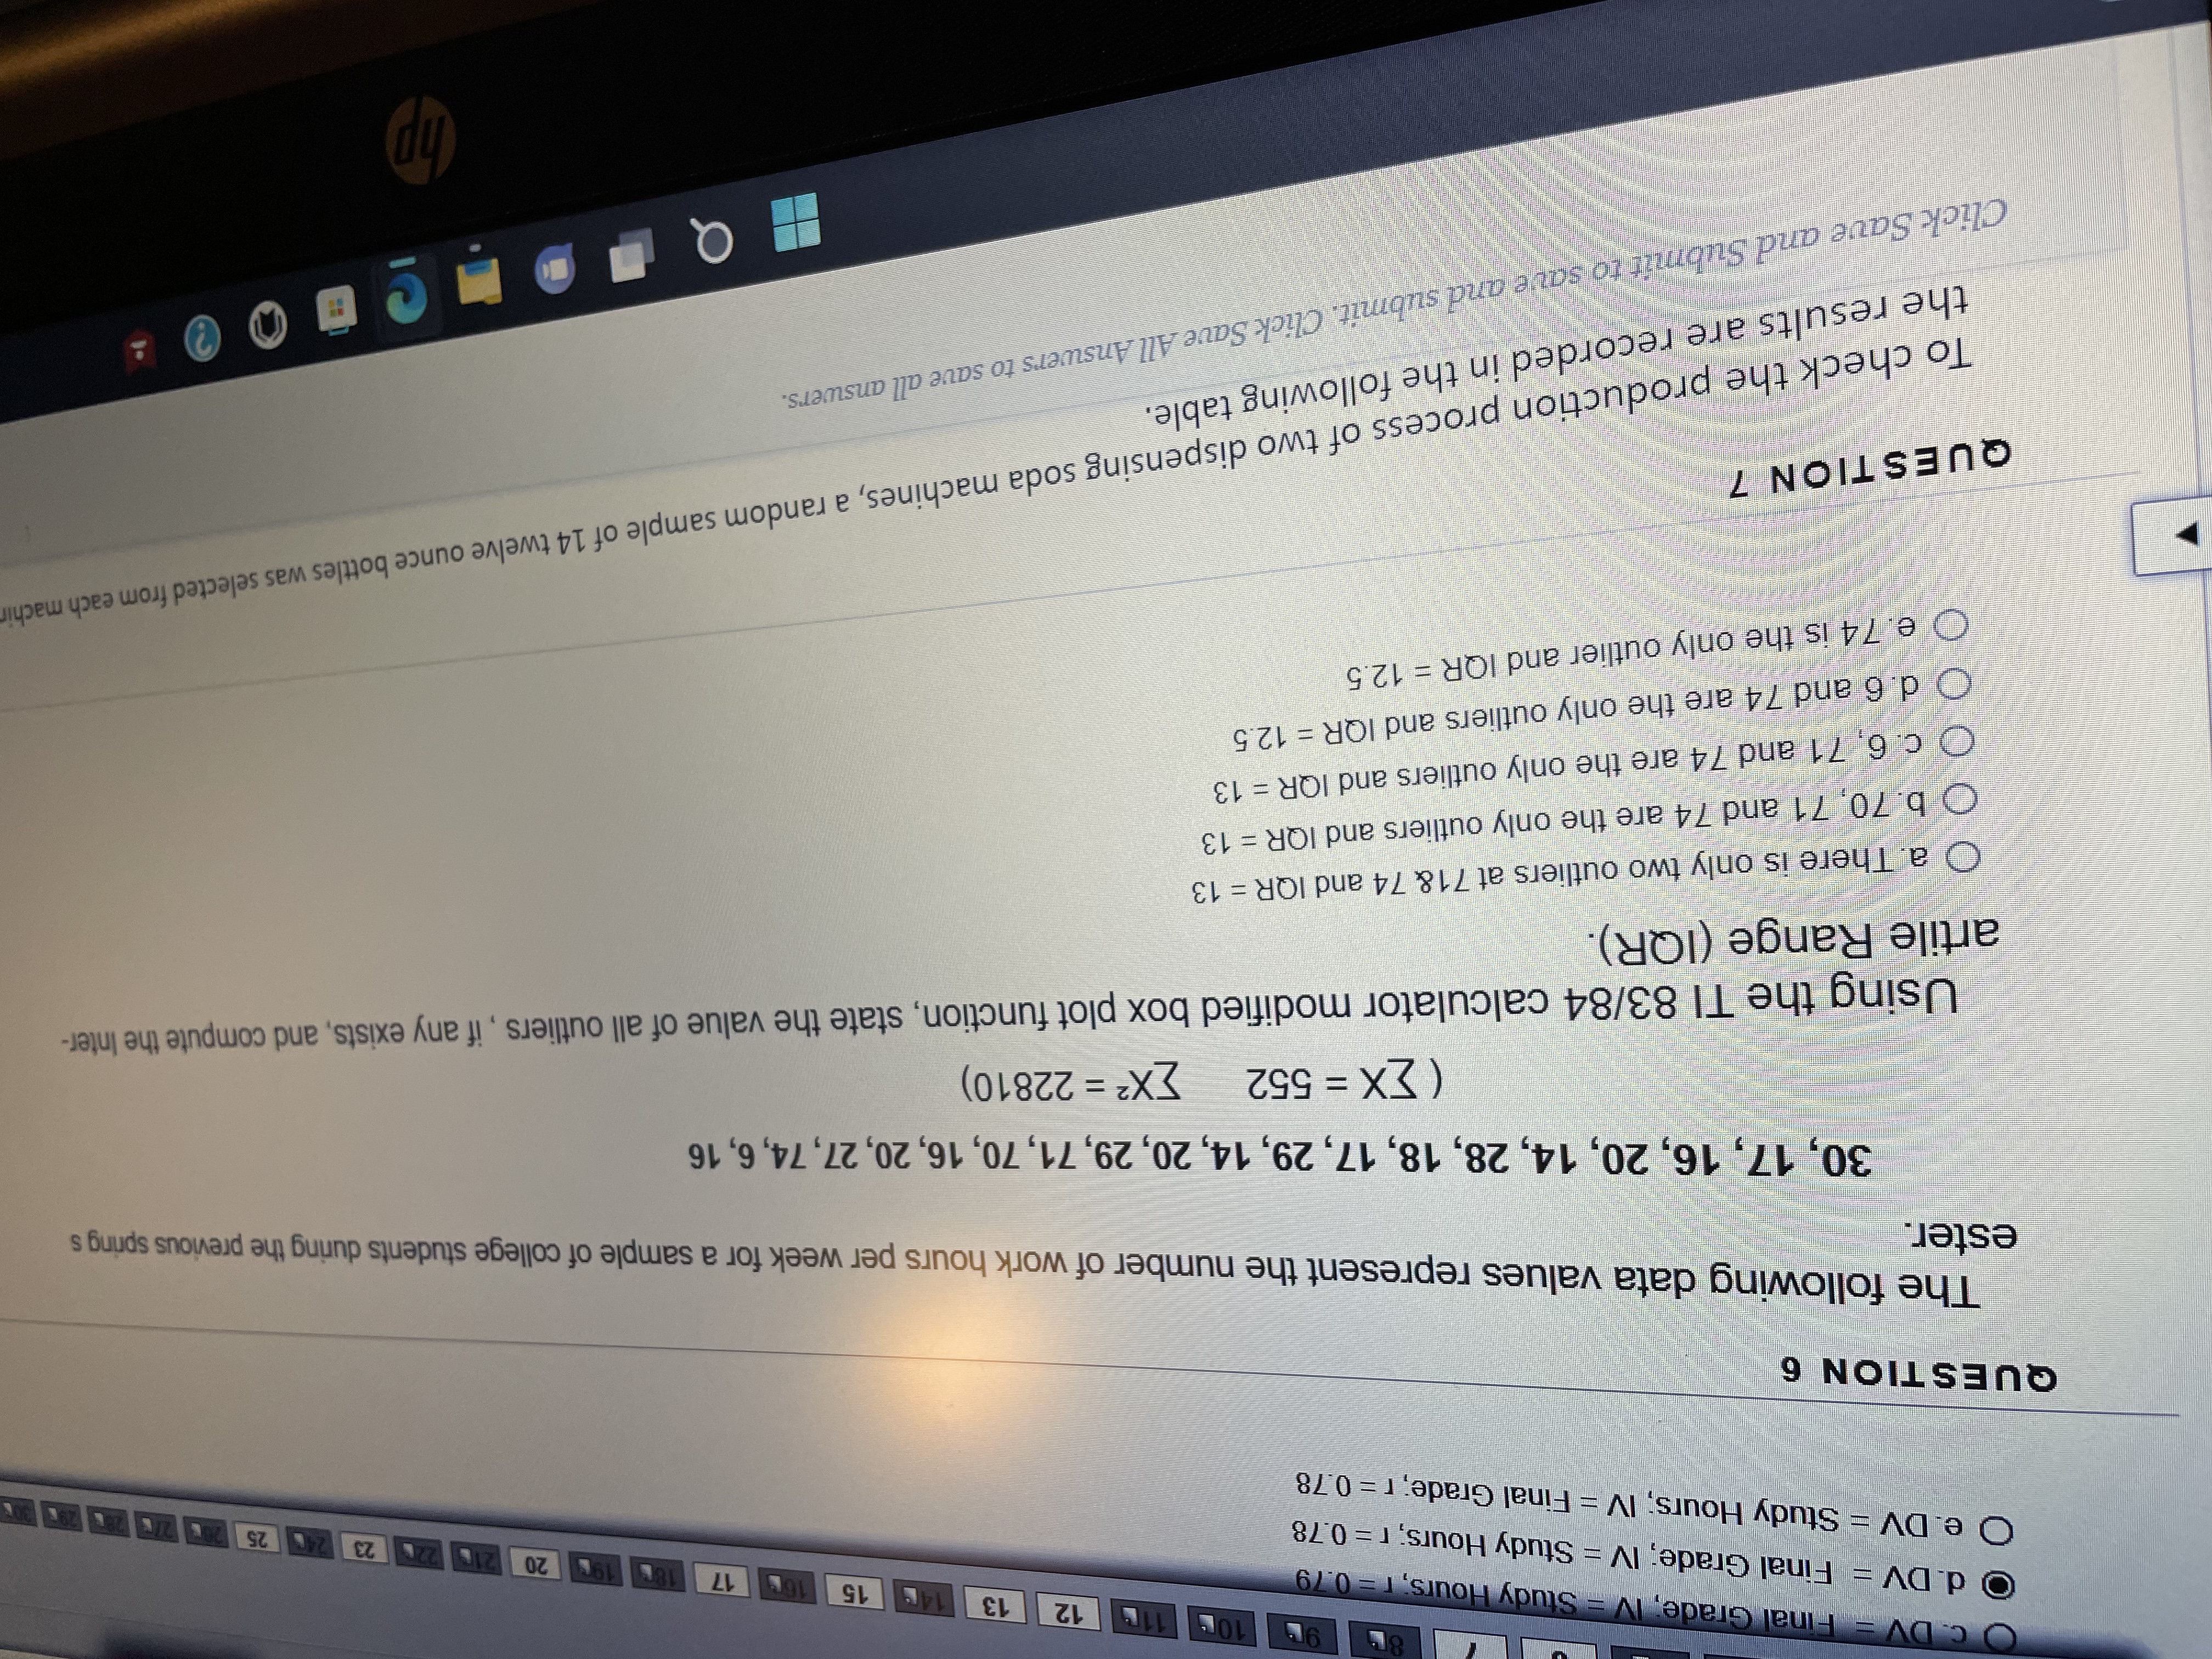


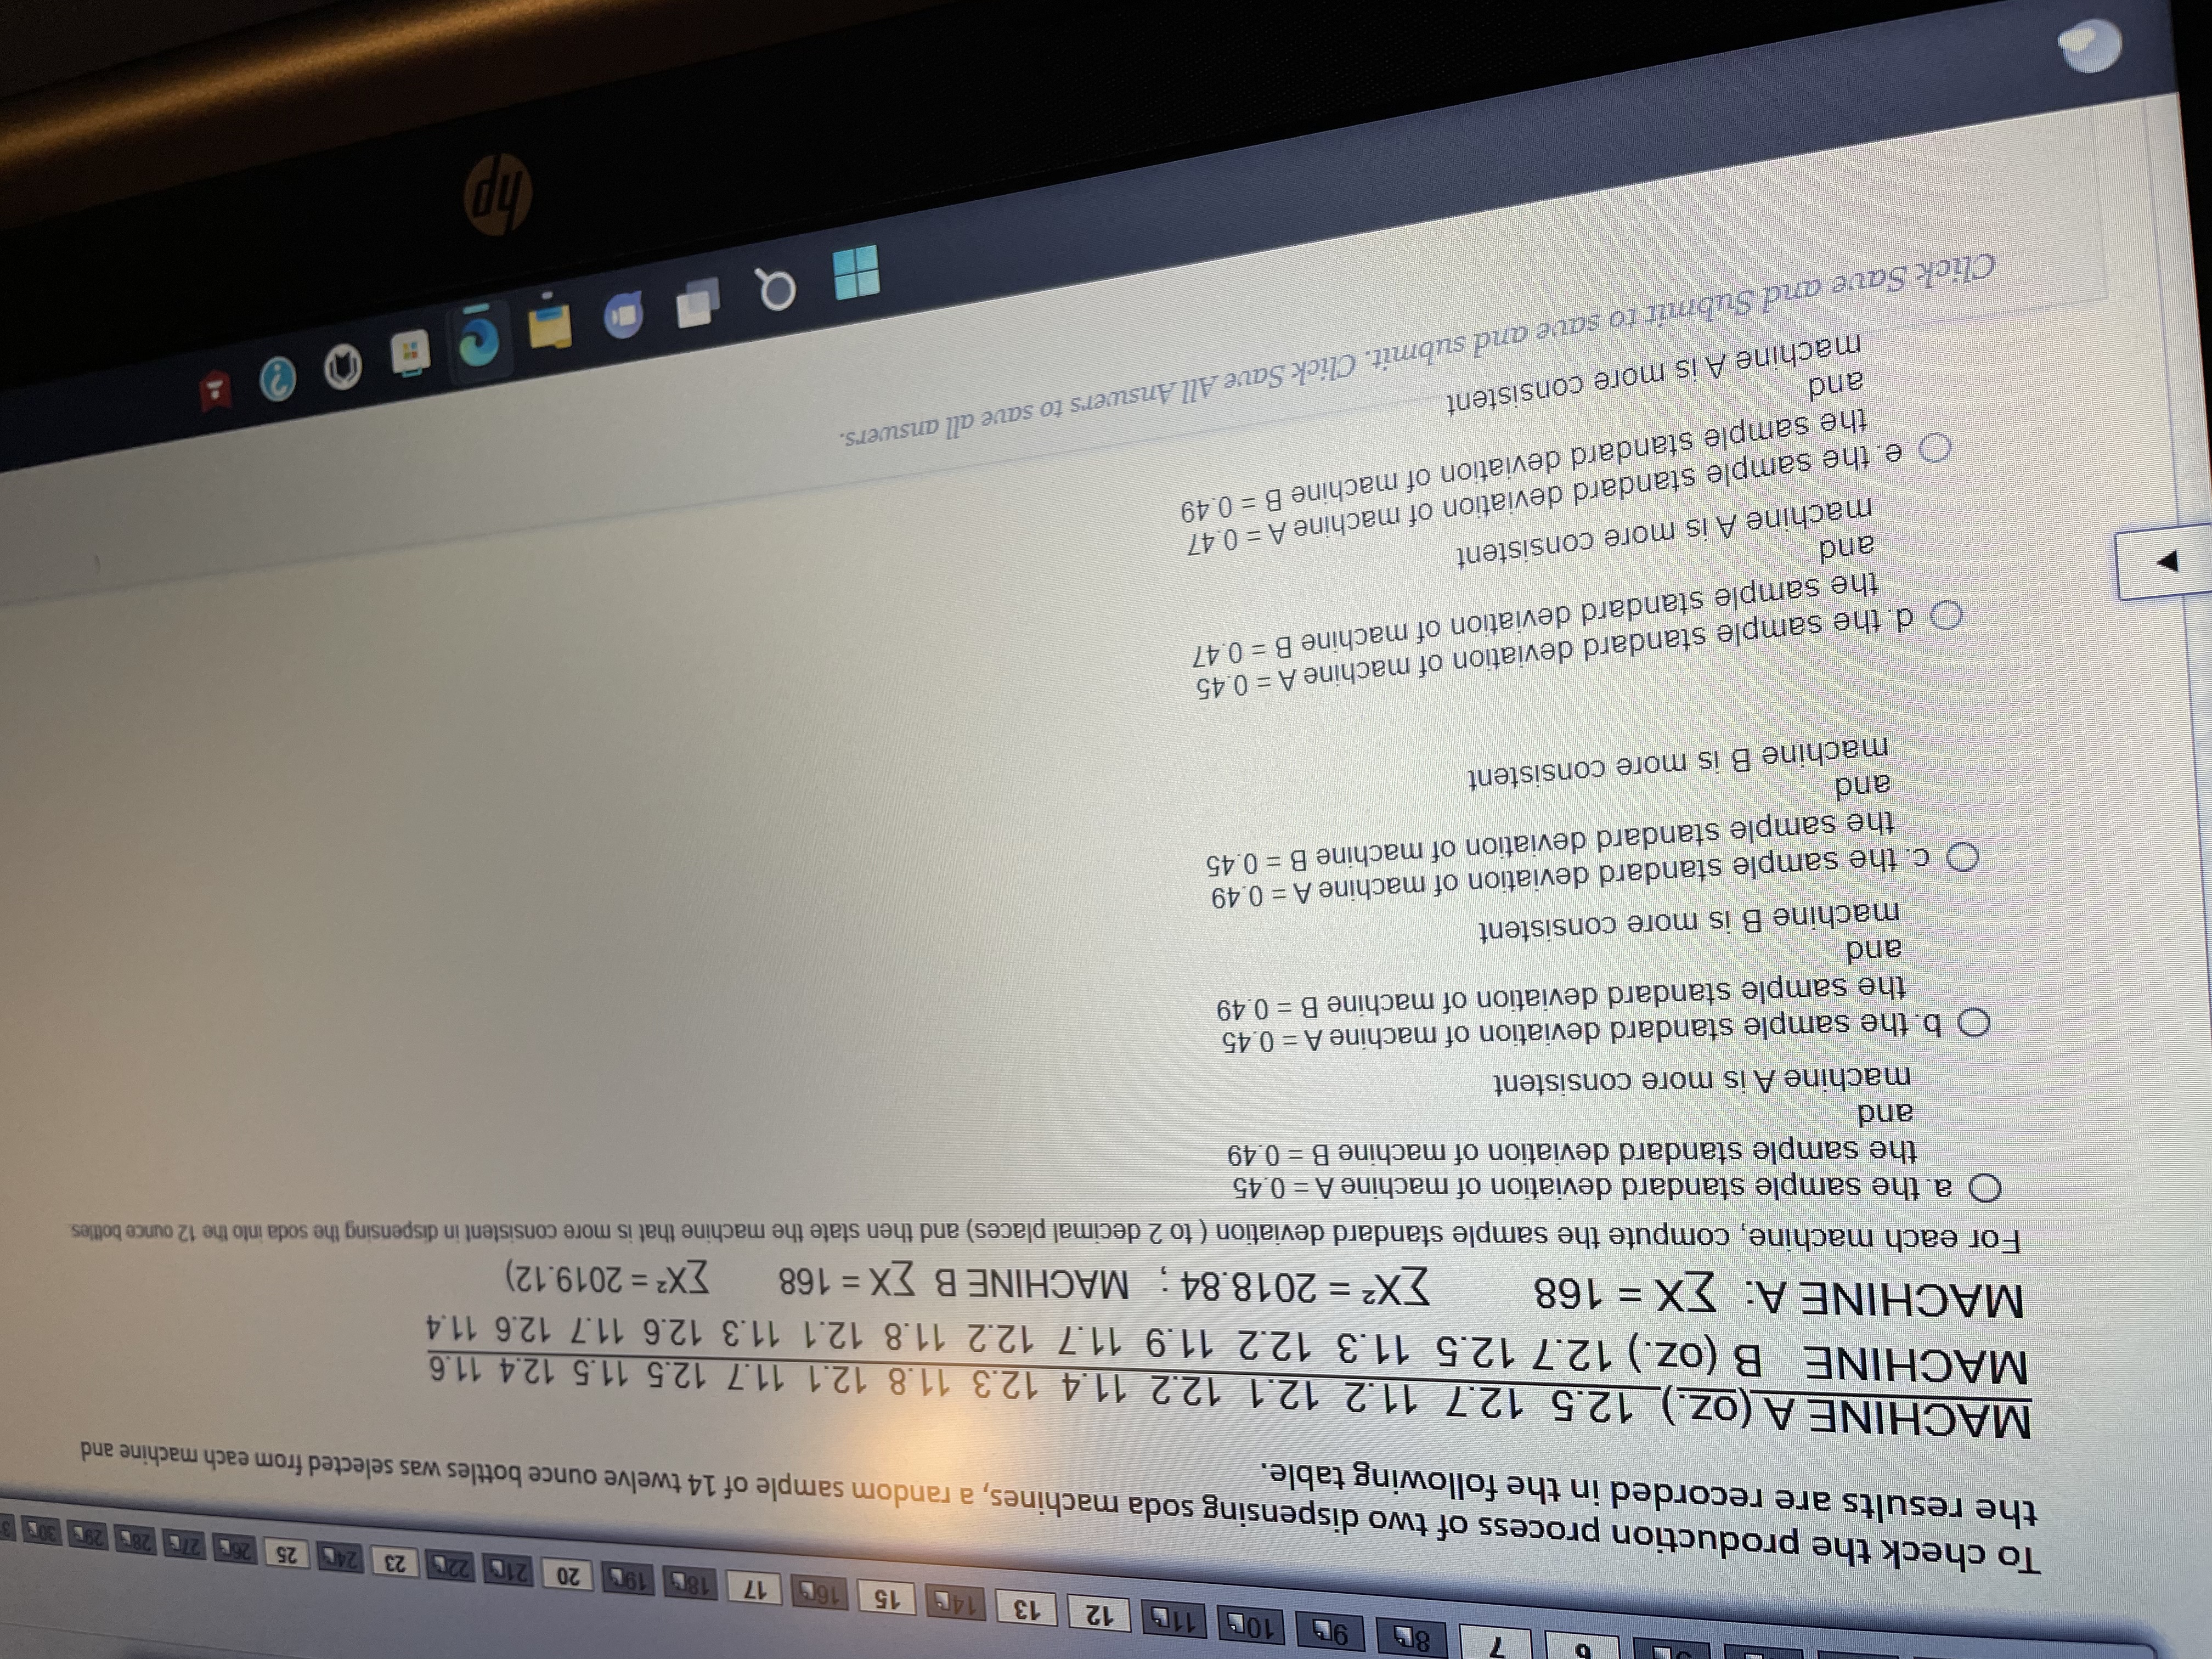
O c. DV - Final Grade, IV - Study Hours, r = 0.79 O d. DV = Final Grade; IV = Study Hours; r = 0.78 90 101 11 12 13 14 15 16 17 18 9 20 26226 23 241 25 2 26 281 20 O e. DV = Study Hours; IV = Final Grade; r = 0.78 QUESTION 6 ester. The following data values represent the number of work hours per week for a sample of college students during the previous spring s 30, 17, 16, 20, 14, 28, 18, 17, 29, 14, 20, 29, 71, 70, 16, 20, 27, 74, 6, 16 ( EX = 552 [X2 = 22810) Using the TI 83/84 calculator modified box plot function, state the value of all outliers , if any exists, and compute the Inter- artile Range (IQR). a. There is only two outliers at 71& 74 and IQR = 13 O b. 70, 71 and 74 are the only outliers and IQR = 13 O c. 6, 71 and 74 are the only outliers and IQR = 13 O d. 6 and 74 are the only outliers and IQR = 12.5 O e. 74 is the only outlier and IQR = 12.5 QUESTION 7 To check the production process of two dispensing soda machines, a random sample of 14 twelve ounce bottles was selected from each machi the results are recorded in the following table. ad submit. Click Save All Answers to save all answers. Click Save and Submit81 90 10 11 12 13 14 15 16 17 18 19 20 210 226 23 246 25 266 276 286 286 305 the results are recorded in the following table. To check the production process of two dispensing soda machines, a random sample of 14 twelve ounce bottles was selected from each machine and MACHINE A (oz.) 12.5 12.7 11.2 12.1 12.2 11.4 12.3 11.8 12.1 11.7 12.5 11.5 12.4 11.6 MACHINE B (oz.) 12.7 12.5 11.3 12.2 11.9 11.7 12.2 11.8 12.1 11.3 12.6 11.7 12.6 11.4 MACHINE A: EX = 168 [X2 = 2018.84 ; MACHINE B EX = 168 For each machine, compute the sample standard deviation ( to 2 decimal places) and then state the machine that is more consistent in dispensing the soda into the 12 ounce bottles. [X2 = 2019.12) O a the sample standard deviation of machine A = 0.45 the sample standard deviation of machine B = 0.49 and machine A is more consistent O b. the sample standard deviation of machine A = 0.45 the sample standard deviation of machine B = 0.49 and machine B is more consistent O c. the sample standard deviation of machine A = 0.49 the sample standard deviation of machine B = 0.45 and machine B is more consistent O d. the sample standard deviation of machine A = 0.45 the sample standard deviation of machine B = 0.47 and machine A is more consistent e. the sample standard deviation of machine A = 0.47 O the sample standard deviation of machine B = 0.49 and machine A is more consistent to save and submit. Click Save All Answers to save all answers. Click Save and Sub
Step by Step Solution
There are 3 Steps involved in it

Get step-by-step solutions from verified subject matter experts