

Question: O LLERELLY R LR LR L e - Perform the Analysis o What is the balance of inventory on hand? What are the descriptive performance
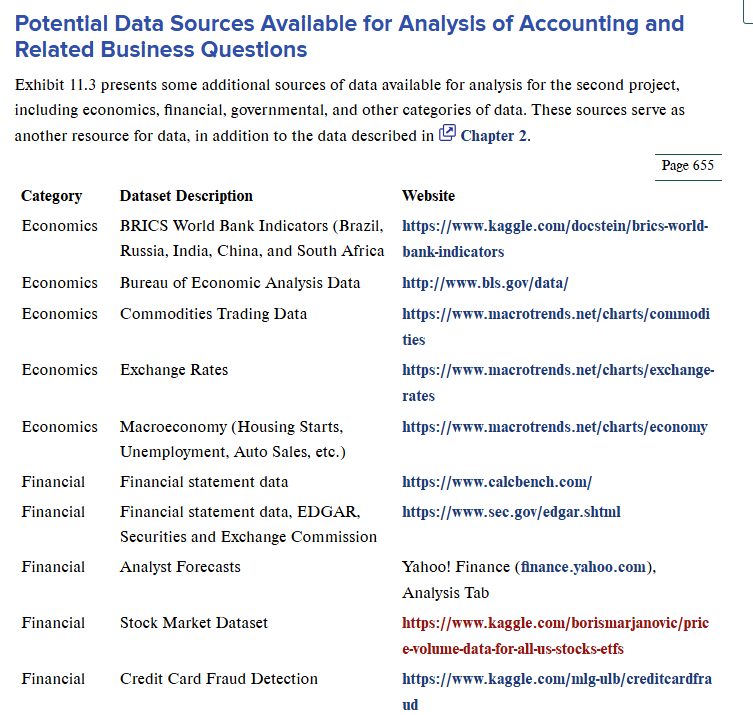
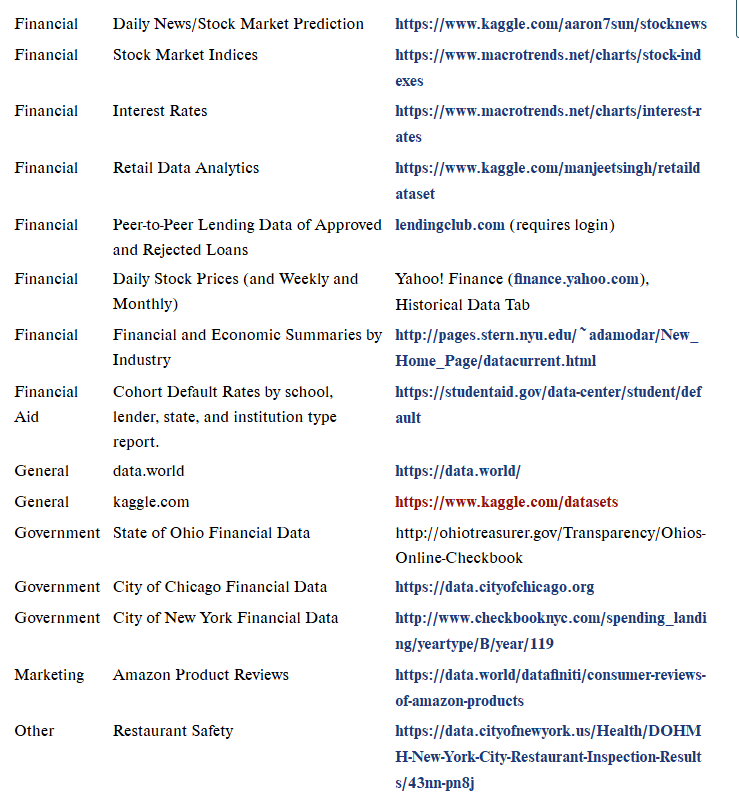
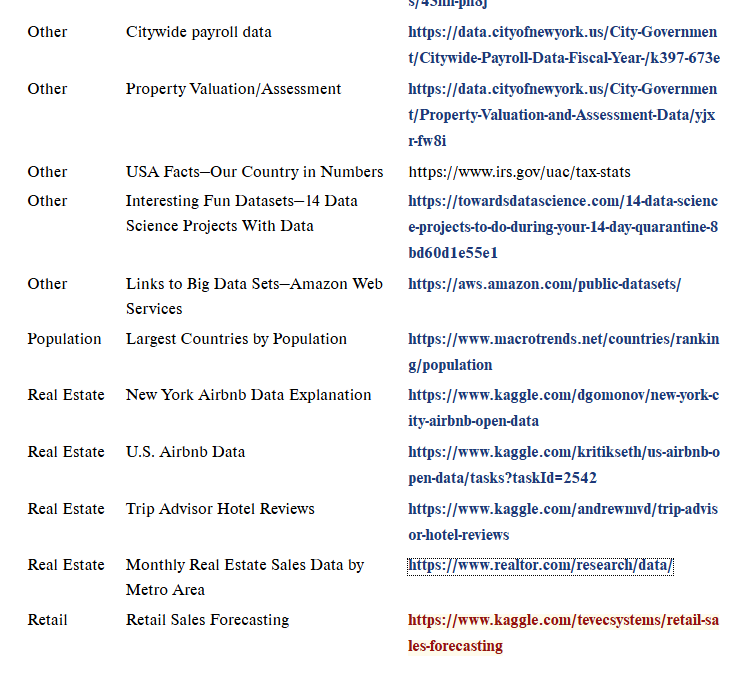
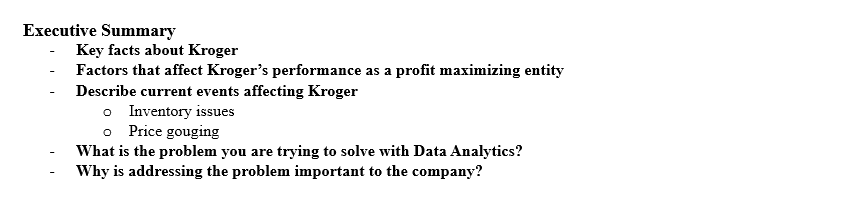
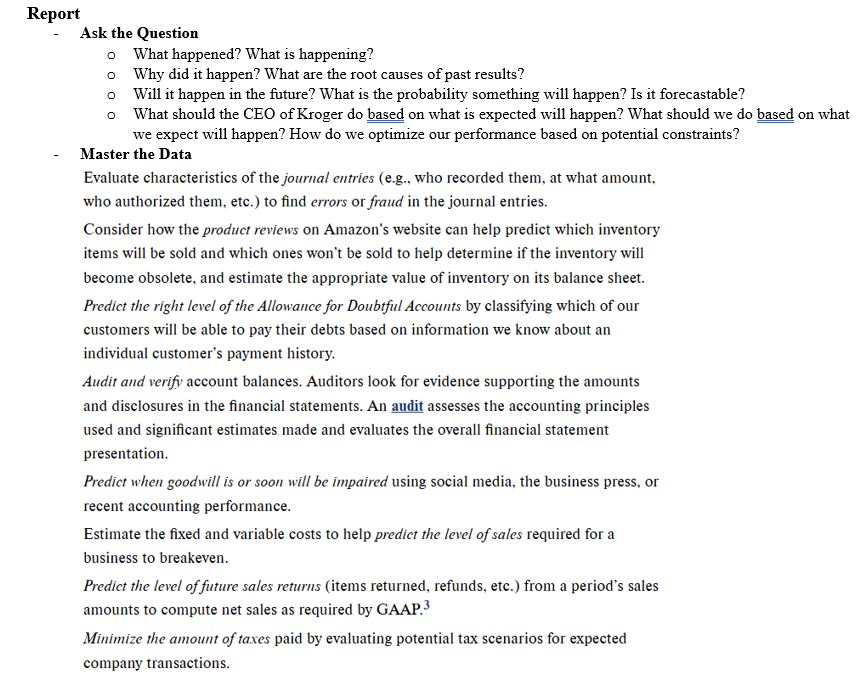
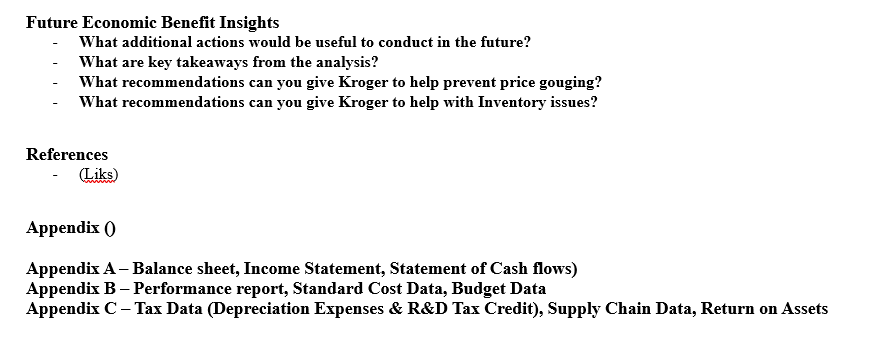
O LLERELLY R LR LR L e - Perform the Analysis o What is the balance of inventory on hand? What are the descriptive performance statistics? What were the Eeturn on Asset, Asset Turnover, Eeturn on profits ratios last vear? Which sales come from related party transactions? Did Kroger's inventory improve this past month? Which product 1s the most profitable one for Kroger? How much did Kroger pay in Federal Taxes last vear? What 1s the effective tax rate paid? How big is the difference between taxable income and net income? o Why did the SG&A costs increase as compared to the industry? Why did the collectability of receivables fall in the current quarter? How can the computations of price variance and labor rate variance help determine the root cause of the operational results? Why did the average effective tax rate change? Why did overall income tax increase even though net income did not? Why is the difference between taxable income and net income getting bigger or smaller? o Can vou forecast the future revenues/cash flows/earnings with reasonable accuracy? What is the chance that Kroger will go bankrupt? Can we predict if the financial statements might be misstated? Do we extend credit or not to customers based on customer characteristics? Can the IRS find those evading taxes using predictive techniques? o How can revenues be maximized if the inventory 1s sourced with more companies? If we have all 12/31 year- end audit clients, how will we organize our audit work in the new year? What 1s the level of sales that will allow Kroger to breakeven? How will Kroger taxes change if certain tax laws change? - Share the story o Describe the data visualizations Explain how the Kroger visualizations communicate its results Describe the appropriate visualizations for diagnostic statistics and analytics Demonstrate the use of predictive statistics and analvtics visualizations o o o o Explain how prescriptive statistics visualizations are used to help Kroger? b Capstone Project Using the AMPS Model You have been asked to present an analysis evaluating an accounting, finance, or other business-related issue that you believe will help the company address an issue. Provide a write-up to the CEO of the company (or director of a nonprofit entity) containing a comprehensive summary of your analysis, as well as any recommendations for further action. Your presentation (at your instructor's option) should summarize your analysis. focusing on your recommendations and justification. At a minimum, your presentation and write-up should include the following information. |. Rackground Overview. Summarize key facts about the business/organization. Describe key factors that affect the organization's performance as a profit-maximizing or governmental entity. If relevant. describe important current events affecting the organization that might give rise to your question. 2. Your Role and Motivation. What is the big picture problem you are trying to address or solve with Data Analytics? Why is addressing this issue important to your organization? 3. Ask the Questions. Specifically, what questions are you trying to answer as part of your solution to this problem? How will you use Data Analytics to address these issues? The more specific you can be with the question, the more specific your search for data and your analysis of the data can be. When asking the question, you should consider if you an gain access to appropriate data that can answer that question. 4, Master the Dara. What is your dataset? As possible data sources, consider those data sources discussed in @Chapter 2, throughout the text, as well as a few other sources of data mentioned in this chapter. You will need to prepare the data (clean it as needed to prepare for analysis to make sure the data is loaded completely; doesn't have missing information: and is machine readable. numeric, and ready for analysis). Are there any issues with data quality and other manipulations, transformations, and additional attributes vou developed? 5. Perform the Analvsiz. How will vou analyze the data? What are the appropriate models and other specific techniques applicable to your questions? What are the main limitations of your analyses? Are vou concerned about data quality issues in your dataset? Capstone Project 2 6. Share the Story. Provide a clear dashboard of key insights from your analysis. What are the key takeaways of your analyses? Provide two recommendations for the business/ organization with supporting analyses/visualizations. 7. Extensions. What additional actions or analyses would be useful to conduct in the future? What additional questions would be useful to answer that are beyond the scope of your project? If you could get any data possible to address these additional questions, what would that data be and how would it help to answer the question?PROJECT 2: COMPLETING YOUR OWN PROJECT USING THE AMPS MODEL Now it is your turn to explore the AMPS model. For this project, you ask the question, find and analyze the data, and then report on the findings. Your team will take on the role of the analyst hired to provide recommendations to the management team of a business/organization on an accounting, finance, or other business-related issue. The question might be helping the company to maximize profits; find the most profitable customers or most efficient worker; or address an accounting issue (such as inventory valuation), a forecast of future earnings, etc. Part 1: Report Required ( 12-point font, single spaced), as follows or as determined by vour instructor: l. Executive summary. Maximum of one page. This section should concisely describe the recommended course of action and the main support for your recommendation. 2. Report. Maximum of three pages. This section should detail the supporting analyses for your recommendations. 3. Report appendix. Maximum of three pages. This section should contain supporting tables, figures, and calculations for your report. Potential Data Sources Available for Analysis of Accounting and Related Business Questions Exhibit 11.3 presents some additional sources of data available for analysis for the second project, including economics, financial, governmental, and other categories of data. These sources serve as another resource for data, in addition to the data described in G Chapter 2. Page 655 Category Dataset Description Website Economics BRICS World Bank Indicators (Brazil, https://www.kaggle.com/docstein/brics-world- Russia, India, China, and South Africa bank-indicators Economics Bureau of Economic Analysis Data http://www.bls.gov/data/ Economics Commodities Trading Data https://www.macrotrends.net/charts/commodi ties Economics Exchange Rates https://www.macrotrends.net/charts/exchange- rates Economics Macroeconomy (Housing Starts, https://www.macrotrends.net/charts/economy Unemployment, Auto Sales, etc.) Financial Financial statement data https://www.calcbench.com/ Financial Financial statement data, EDGAR, https://www.sec.gov/edgar.shtml Securities and Exchange Commission Financial Analyst Forecasts Yahoo! Finance (finance.yahoo.com), Analysis Tab Financial Stock Market Dataset https://www.kaggle.com/borismarjanovic/pric e-volume-data-for-all-us-stocks-etfs Financial Credit Card Fraud Detection https://www.kaggle.com/mig-ulb/creditcardfra udFinancial Daily News/Stock Market Prediction https://www.kaggle.com/aaron7sun/stocknews Financial Stock Market Indices https://www.macrotrends.net/charts/stock-ind exes Financial Interest Rates https://www.macrotrends.net/charts/interest-r ates Financial Retail Data Analytics https://www.kaggle.com/manjeetsingh/retaild ataset Financial Peer-to-Peer Lending Data of Approved lendingclub.com (requires login) and Rejected Loans Financial Daily Stock Prices (and Weekly and Yahoo! Finance (finance.yahoo.com), Monthly) Historical Data Tab Financial Financial and Economic Summaries by http://pages.stern.nyu.edu/ * adamodar/New_ Industry Home_Page/datacurrent.html Financial Cohort Default Rates by school, https://studentaid.gov/data-center/student/def Aid lender, state, and institution type ault report. General data.world https://data.world/ General kaggle.com https://www.kaggle.com/datasets Government State of Ohio Financial Data http://ohiotreasurer.gov/Transparency/Ohios- Online-Checkbook Government City of Chicago Financial Data https://data.cityofchicago.org Government City of New York Financial Data http://www.checkbooknyc.com/spending_landi ng/yeartype/B/year/119 Marketing Amazon Product Reviews https://data.world/datafiniti/consumer-reviews- of-amazon-products Other Restaurant Safety https://data.cityofnewyork.us/Health/DOHM H-New-York-City-Restaurant-Inspection-Result $/43nn-pn8jOther Citywide payroll data https://data.cityofnewyork.us/City-Governmen t/Citywide-Payroll-Data-Fiscal-Year-/k397-673e Other Property Valuation/Assessment https://data.cityofnewyork.us/City-Governmen t/Property-Valuation-and-Assessment-Data/yjx r-fw8i Other USA Facts-Our Country in Numbers https://www.irs.gov/uac/tax-stats Other Interesting Fun Datasets-14 Data https://towardsdatascience.com/14-data-scienc Science Projects With Data e-projects-to-do-during-your-14-day-quarantine-8 bd60d1e55el Other Links to Big Data Sets-Amazon Web https://aws.amazon.com/public-datasets/ Services Population Largest Countries by Population https://www.macrotrends.net/countries/rankin g/population Real Estate New York Airbnb Data Explanation https://www.kaggle.com/dgomonovew-york-c ity-airbnb-open-data Real Estate U.S. Airbnb Data https://www.kaggle.com/kritikseth/us-airbnb-o pen-data/tasks?taskId=2542 Real Estate Trip Advisor Hotel Reviews https://www.kaggle.com/andrewmvd/trip-advis or-hotel-reviews Real Estate Monthly Real Estate Sales Data by littps:/www.realtor.com/research/data/ Metro Area Retail Retail Sales Forecasting https://www.kaggle.com/tevecsystems/retail-sa les-forecastingExecutive Summary - Key facts about Kroger - Factors that affect Kroger's performance as a profit maximizing entity - Describe current events affecting Kroger o Inventory issues o Price gouging - What is the problem you are trying to solve with Data Analytics? - Why is addressing the problem important to the company? Report Ask the Question o What happened? What 1s happening? o Why did it happen? What are the root causes of past results? o Will it happen in the future? What is the probability something will happen? Is 1t forecastable? o What should the CEO of Kroger do based on what is expected will happen? What should we do based on what we expect will happen? How do we optimize our performance based on potential constraints? Master the Data Evaluate characteristics of the jeurnal entries (e.g., who recorded them, at what amount, who authorized them, etc.) to find errors or fraud in the journal entries. Consider how the product reviews on Amazon''s website can help predict which inventory items will be sold and which ones won't be sold to help determine if the inventory will become obsolete, and estimate the appropriate value of inventory on its balance sheet. Predict the right level of the Allowance for Doubtful Accounts by classifying which of our customers will be able to pay their debts based on information we know about an individual customer's payment history. Audir and verifi account balances. Auditors look for evidence supporting the amounts and disclosures in the financial statements. An audit assesses the accounting principles used and significant estimates made and evaluates the overall financial statement presentation, Predict when goodwill is or soon will be impaired using social media, the business press, or recent accounting performance. Estimate the fixed and variable costs to help predict the level of sales required for a business to breakeven. Predict the level of future sales returns (items returned, refunds, etc.) from a period's sales amounts to compute net sales as required by GAAP? Minimize the amount of taxes paid by evaluating potential tax scenarios for expected company transactions. Future Economic Benefit Insights - What additional actions would be useful to conduct in the future? - What are key takeaways from the analysis? - What recommendations can vou give Kroger to help prevent price gouging? - What recommendations can vou give Kroger to help with Inventory issues? References Appendix () Appendix A Balance sheet, Income Statement, Statement of Cash flows) Appendix B Performance report, Standard Cost Data, Budget Data Appendix C Tax Data (Depreciation Expenses & R&D Tax Credit), Supply Chain Data, Return on Assets
Step by Step Solution
There are 3 Steps involved in it

Get step-by-step solutions from verified subject matter experts