

Question: O O The following data sets were obtained from a reaction catalyzed by an enzyme, where Ceo is the concentration of enzyme, Ci is the
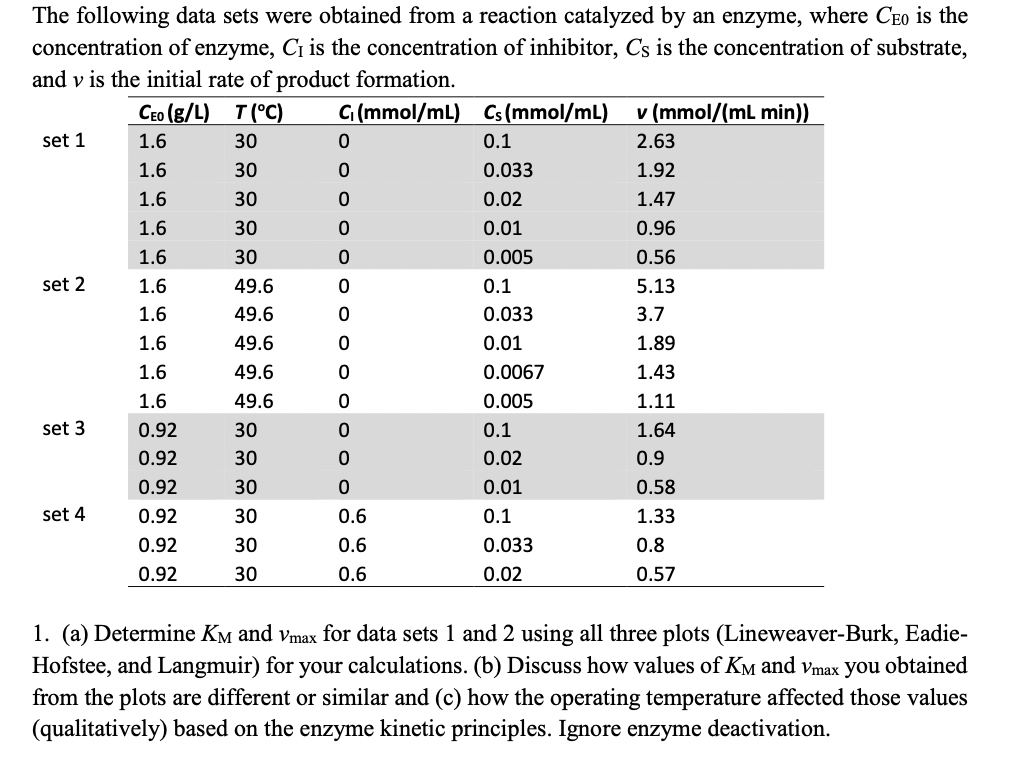
O O The following data sets were obtained from a reaction catalyzed by an enzyme, where Ceo is the concentration of enzyme, Ci is the concentration of inhibitor, Cs is the concentration of substrate, and v is the initial rate of product formation. Ceo (g/L) T(C) G(mmol/ml) Cs(mmol/mL). v (mmol/(mL min)) set 1 1.6 30 0 0.1 2.63 1.6 30 0 0.033 1.92 1.6 30 0.02 1.47 1.6 30 0 0.01 0.96 1.6 30 0 0.005 0.56 set 2 1.6 49.6 0 0.1 5.13 1.6 49.6 0.033 3.7 1.6 49.6 0.01 1.89 1.6 49.6 0.0067 1.43 1.6 49.6 0.005 1.11 set 3 0.92 30 0.1 1.64 0.92 30 0.02 0.9 0.92 30 0.01 0.58 set 4 0.92 30 0.6 0.1 1.33 0.92 30 0.6 0.033 0.8 0.92 30 0.6 0.02 0.57 1. (a) Determine Km and Vmax for data sets 1 and 2 using all three plots (Lineweaver-Burk, Eadie- Hofstee, and Langmuir) for your calculations. (b) Discuss how values of Km and Vmax you obtained from the plots are different or similar and (c) how the operating temperature affected those values (qualitatively) based on the enzyme kinetic principles. Ignore enzyme deactivation
Step by Step Solution
There are 3 Steps involved in it

Get step-by-step solutions from verified subject matter experts