

O Period T K J FR P D S O N IP H Ps OG...
Fantastic news! We've Found the answer you've been seeking!
Question:

Transcribed Image Text:
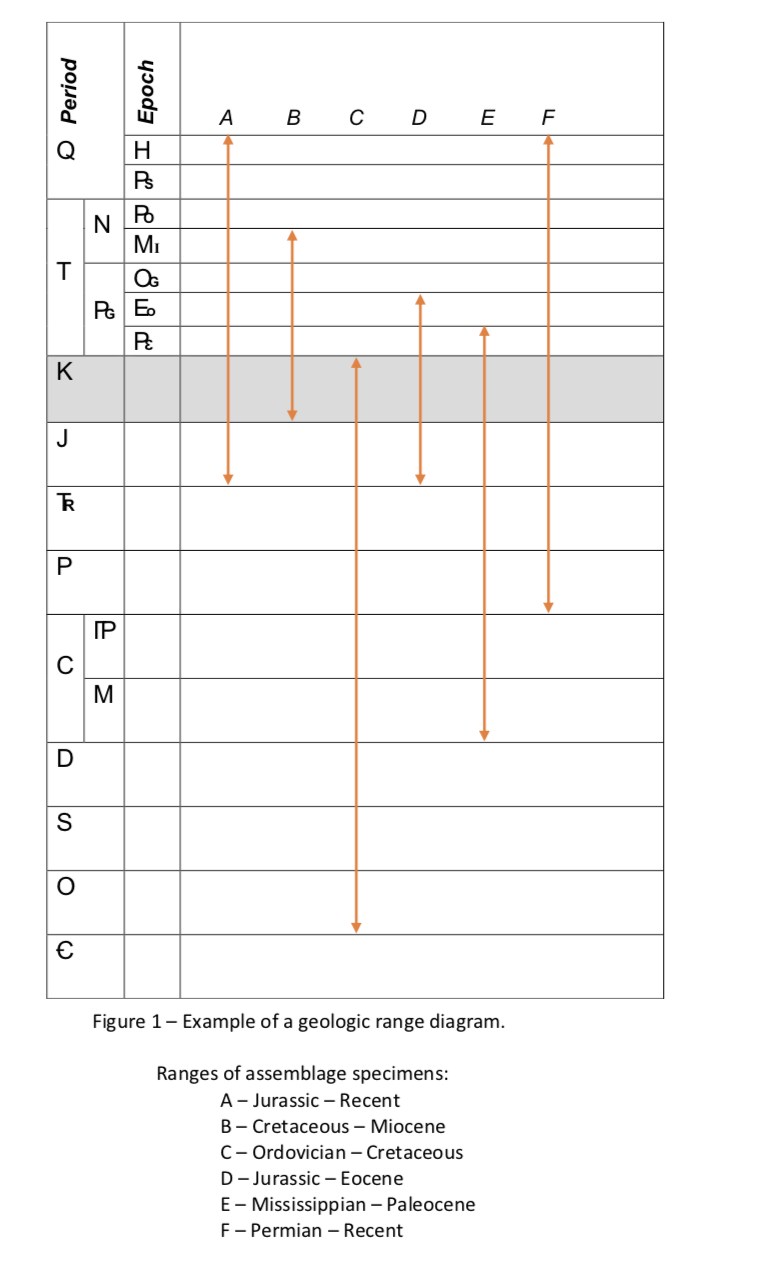
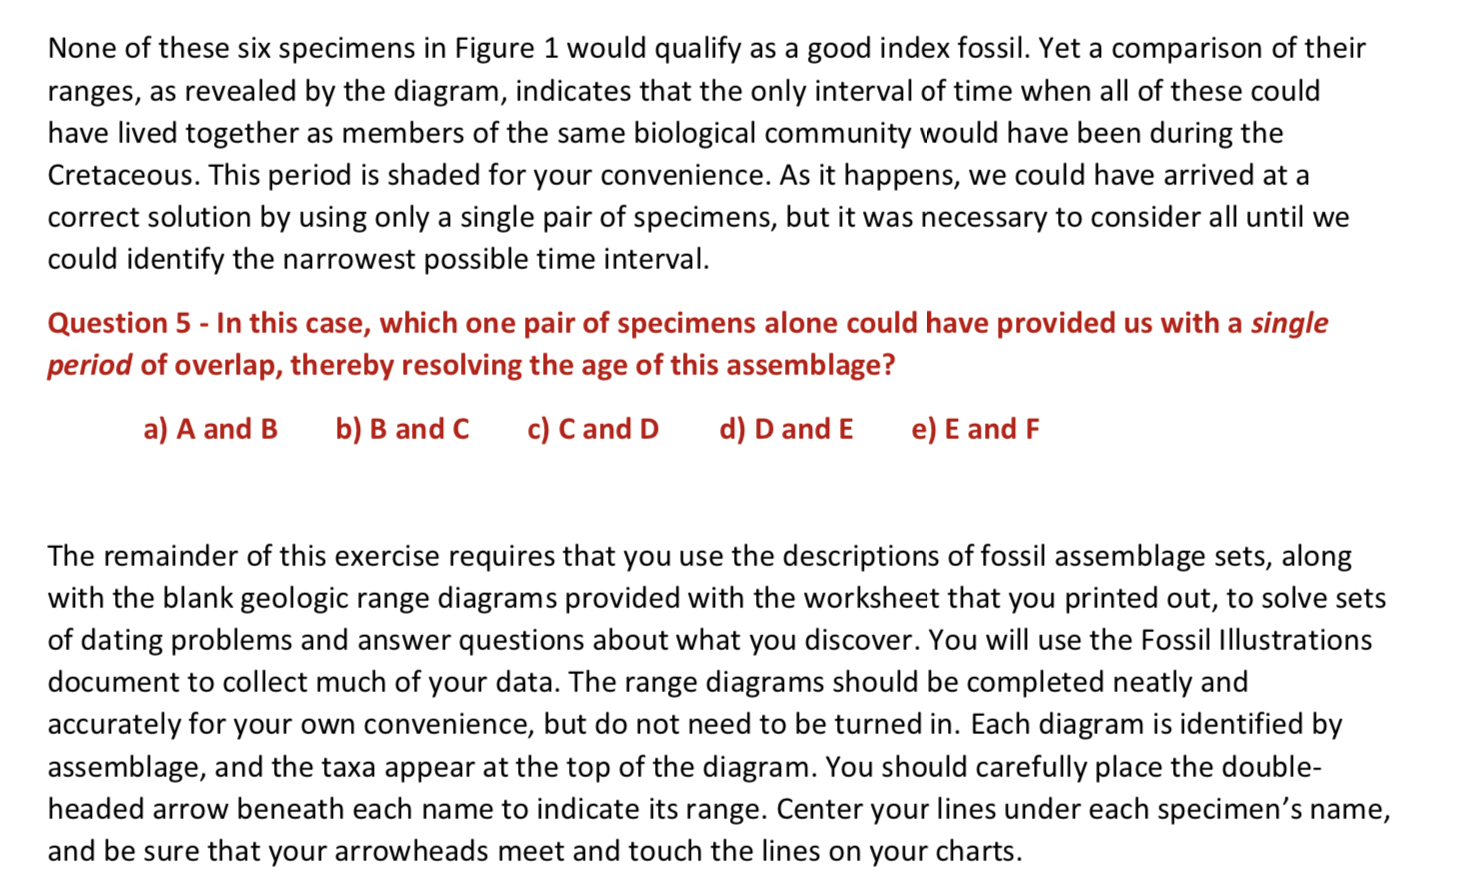
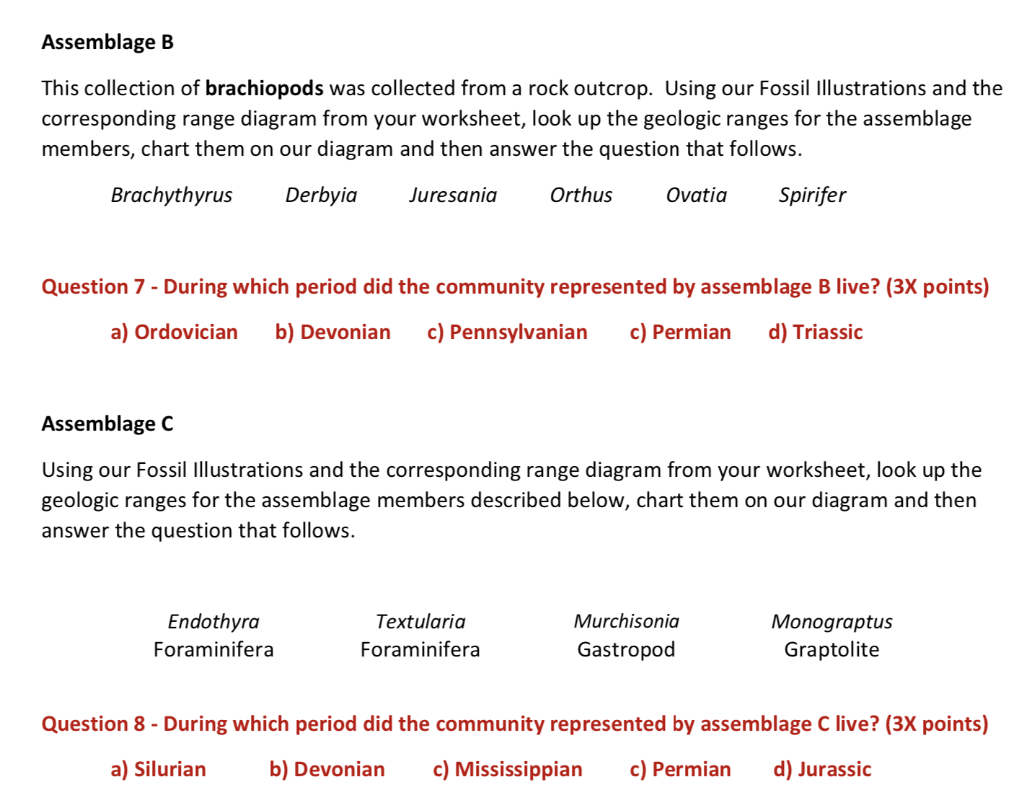
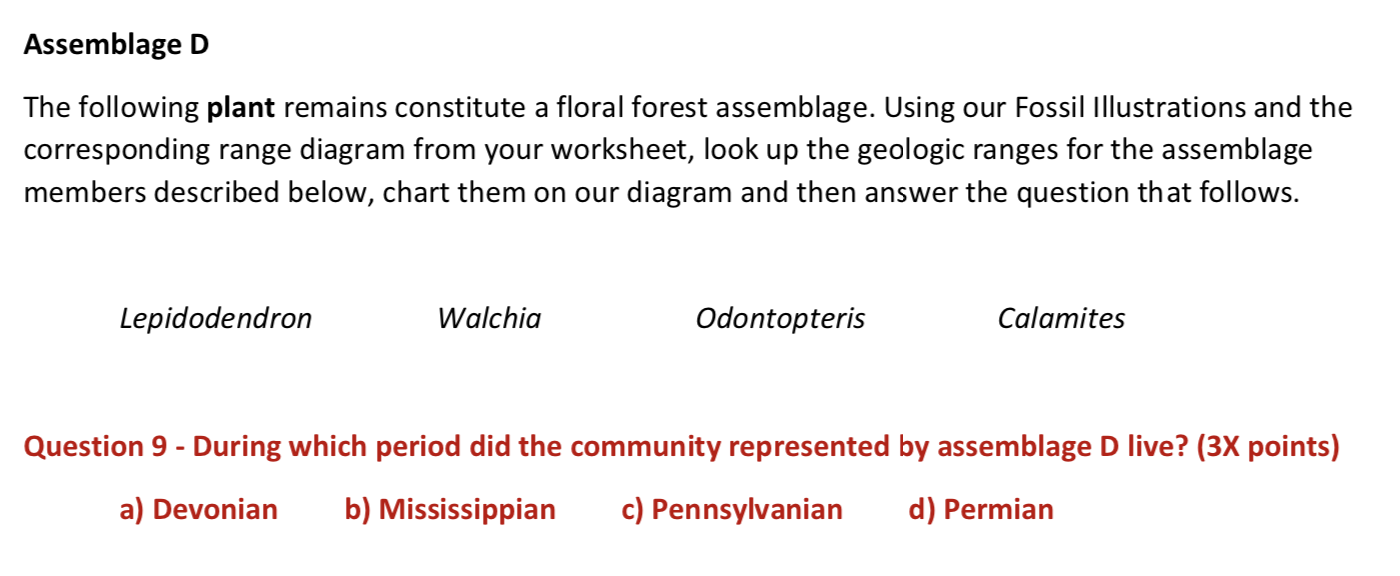
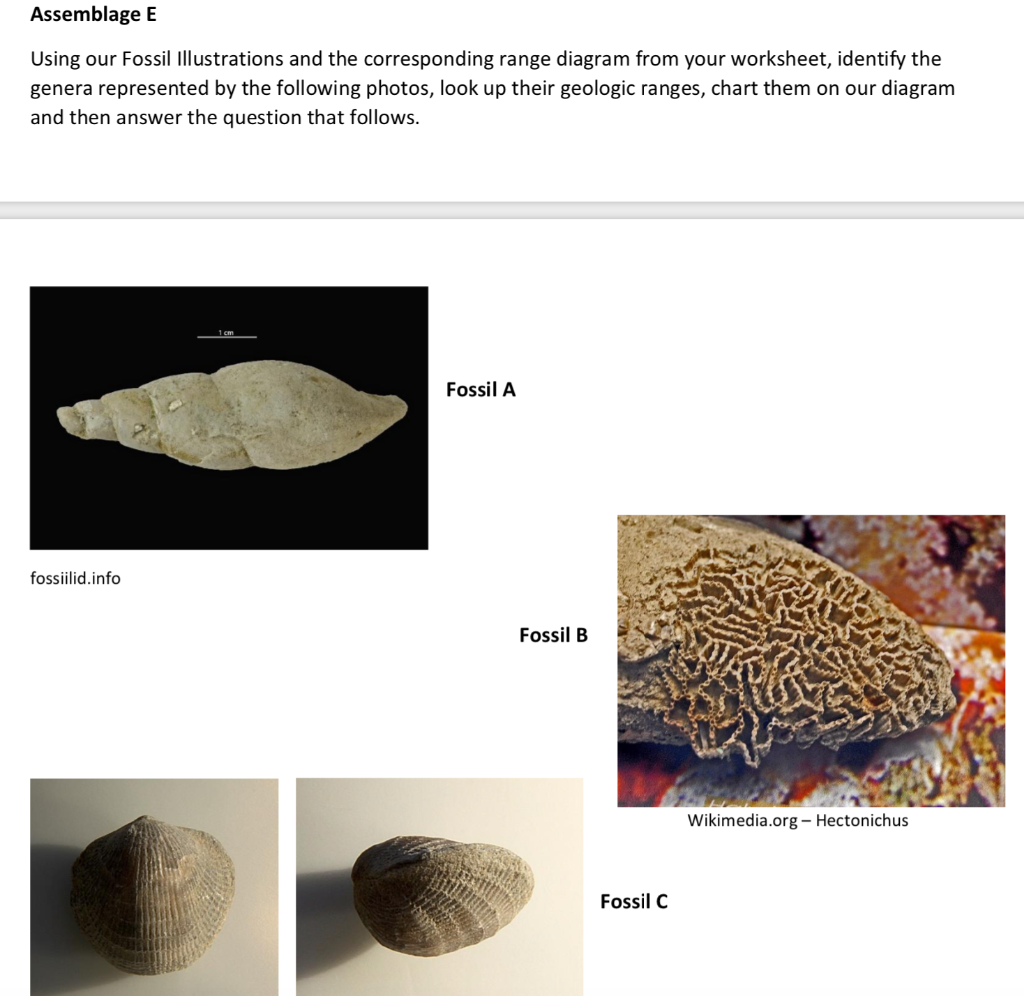
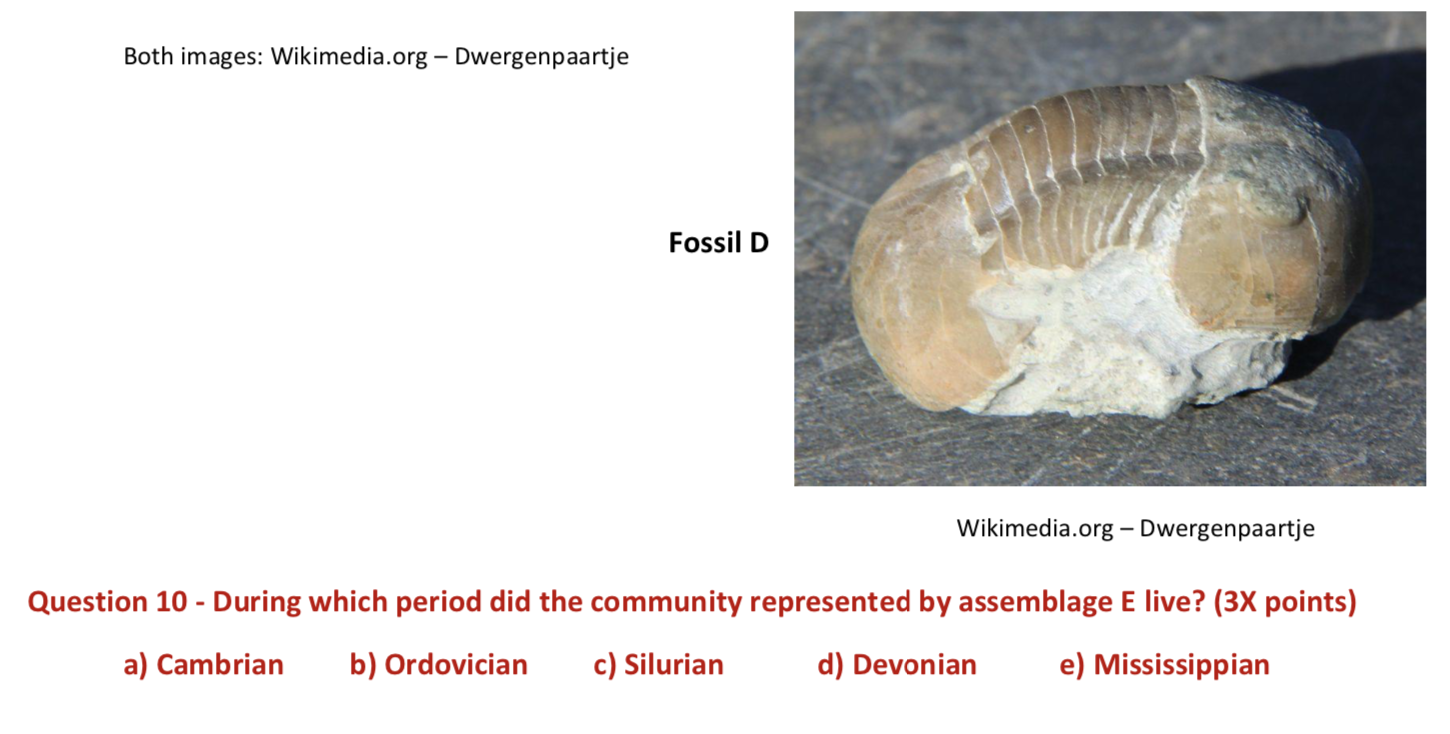
O Period T K J FR P D S O € N IP H Ps OG PG| Eo P M Po M₁ A B C D E F Figure 1 - Example of a geologic range diagram. Ranges of assemblage specimens: A-Jurassic - Recent B - Cretaceous - Miocene C- Ordovician - Cretaceous D-Jurassic - Eocene E- Mississippian - Paleocene F-Permian - Recent None of these six specimens in Figure 1 would qualify as a good index fossil. Yet a comparison of their ranges, as revealed by the diagram, indicates that the only interval of time when all of these could have lived together as members of the same biological community would have been during the Cretaceous. This period is shaded for your convenience. As it happens, we could have arrived at a correct solution by using only a single pair of specimens, but it was necessary to consider all until we could identify the narrowest possible time interval. Question 5 - In this case, which one pair of specimens alone could have provided us with a single period of overlap, thereby resolving the age of this assemblage? a) A and B b) B and C c) C and D d) D and E e) E and F The remainder of this exercise requires that you use the descriptions of fossil assemblage sets, along with the blank geologic range diagrams provided with the worksheet that you printed out, to solve sets of dating problems and answer questions about what you discover. You will use the Fossil Illustrations document to collect much of your data. The range diagrams should be completed neatly and accurately for your own convenience, but do not need to be turned in. Each diagram is identified by assemblage, and the taxa appear at the top of the diagram. You should carefully place the double- headed arrow beneath each name to indicate its range. Center your lines under each specimen's name, and be sure that your arrowheads meet and touch the lines on your charts. Assemblage A Using the Assemblage A range diagram from your worksheet, chart the geologic ranges for the following assemblage and then answer the question that follows. Specimen A1 - Cambrian - Permian Specimen A2 - Cambrian - Mississippian Specimen A3 - Devonian - Jurassic Specimen A4 - Mississippian - Jurassic Specimen A5 - Silurian - Pennsylvanian Specimen A6 - Mississippian – Permian Specimen A7 - Devonian - Cretaceous Question 6 - During which period did the community represented by assemblage A live? (3x points) a) Devonian b) Mississippian c) Pennsylvanian c) Permian d) Jurassic Assemblage B This collection of brachiopods was collected from a rock outcrop. Using our Fossil Illustrations and the corresponding range diagram from your worksheet, look up the geologic ranges for the assemblage members, chart them on our diagram and then answer the question that follows. Brachythyrus Derbyia Juresania Orthus Ovatia Spirifer Question 7 - During which period did the community represented by assemblage B live? (3X points) a) Ordovician b) Devonian c) Pennsylvanian c) Permian d) Triassic Assemblage C Using our Fossil Illustrations and the corresponding range diagram from your worksheet, look up the geologic ranges for the assemblage members described below, chart them on our diagram and then answer the question that follows. Endothyra Foraminifera Textularia Foraminifera Murchisonia Gastropod Monograptus Graptolite Question 8 - During which period did the community represented by assemblage C live? (3X points) a) Silurian b) Devonian c) Mississippian c) Permian d) Jurassic Assemblage D The following plant remains constitute a floral forest assemblage. Using our Fossil Illustrations and the corresponding range diagram from your worksheet, look up the geologic ranges for the assemblage members described below, chart them on our diagram and then answer the question that follows. Lepidodendron Walchia Odontopteris Calamites Question 9 - During which period did the community represented by assemblage D live? (3x points) a) Devonian b) Mississippian c) Pennsylvanian d) Permian Assemblage E Using our Fossil Illustrations and the corresponding range diagram from your worksheet, identify the genera represented by the following photos, look up their geologic ranges, chart them on our diagram and then answer the question that follows. fossiilid.info Fossil A Fossil B Fossil C Wikimedia.org - Hectonichus Both images: Wikimedia.org - Dwergenpaartje Fossil D Wikimedia.org - Dwergenpaartje Question 10 - During which period did the community represented by assemblage E live? (3X points) a) Cambrian b) Ordovician c) Silurian d) Devonian e) Mississippian O Period T K J FR P D S O € N IP H Ps OG PG| Eo P M Po M₁ A B C D E F Figure 1 - Example of a geologic range diagram. Ranges of assemblage specimens: A-Jurassic - Recent B - Cretaceous - Miocene C- Ordovician - Cretaceous D-Jurassic - Eocene E- Mississippian - Paleocene F-Permian - Recent None of these six specimens in Figure 1 would qualify as a good index fossil. Yet a comparison of their ranges, as revealed by the diagram, indicates that the only interval of time when all of these could have lived together as members of the same biological community would have been during the Cretaceous. This period is shaded for your convenience. As it happens, we could have arrived at a correct solution by using only a single pair of specimens, but it was necessary to consider all until we could identify the narrowest possible time interval. Question 5 - In this case, which one pair of specimens alone could have provided us with a single period of overlap, thereby resolving the age of this assemblage? a) A and B b) B and C c) C and D d) D and E e) E and F The remainder of this exercise requires that you use the descriptions of fossil assemblage sets, along with the blank geologic range diagrams provided with the worksheet that you printed out, to solve sets of dating problems and answer questions about what you discover. You will use the Fossil Illustrations document to collect much of your data. The range diagrams should be completed neatly and accurately for your own convenience, but do not need to be turned in. Each diagram is identified by assemblage, and the taxa appear at the top of the diagram. You should carefully place the double- headed arrow beneath each name to indicate its range. Center your lines under each specimen's name, and be sure that your arrowheads meet and touch the lines on your charts. Assemblage A Using the Assemblage A range diagram from your worksheet, chart the geologic ranges for the following assemblage and then answer the question that follows. Specimen A1 - Cambrian - Permian Specimen A2 - Cambrian - Mississippian Specimen A3 - Devonian - Jurassic Specimen A4 - Mississippian - Jurassic Specimen A5 - Silurian - Pennsylvanian Specimen A6 - Mississippian – Permian Specimen A7 - Devonian - Cretaceous Question 6 - During which period did the community represented by assemblage A live? (3x points) a) Devonian b) Mississippian c) Pennsylvanian c) Permian d) Jurassic Assemblage B This collection of brachiopods was collected from a rock outcrop. Using our Fossil Illustrations and the corresponding range diagram from your worksheet, look up the geologic ranges for the assemblage members, chart them on our diagram and then answer the question that follows. Brachythyrus Derbyia Juresania Orthus Ovatia Spirifer Question 7 - During which period did the community represented by assemblage B live? (3X points) a) Ordovician b) Devonian c) Pennsylvanian c) Permian d) Triassic Assemblage C Using our Fossil Illustrations and the corresponding range diagram from your worksheet, look up the geologic ranges for the assemblage members described below, chart them on our diagram and then answer the question that follows. Endothyra Foraminifera Textularia Foraminifera Murchisonia Gastropod Monograptus Graptolite Question 8 - During which period did the community represented by assemblage C live? (3X points) a) Silurian b) Devonian c) Mississippian c) Permian d) Jurassic Assemblage D The following plant remains constitute a floral forest assemblage. Using our Fossil Illustrations and the corresponding range diagram from your worksheet, look up the geologic ranges for the assemblage members described below, chart them on our diagram and then answer the question that follows. Lepidodendron Walchia Odontopteris Calamites Question 9 - During which period did the community represented by assemblage D live? (3x points) a) Devonian b) Mississippian c) Pennsylvanian d) Permian Assemblage E Using our Fossil Illustrations and the corresponding range diagram from your worksheet, identify the genera represented by the following photos, look up their geologic ranges, chart them on our diagram and then answer the question that follows. fossiilid.info Fossil A Fossil B Fossil C Wikimedia.org - Hectonichus Both images: Wikimedia.org - Dwergenpaartje Fossil D Wikimedia.org - Dwergenpaartje Question 10 - During which period did the community represented by assemblage E live? (3X points) a) Cambrian b) Ordovician c) Silurian d) Devonian e) Mississippian
Expert Answer:

Related Book For 

Income Tax Fundamentals 2013
ISBN: 9781285586618
31st Edition
Authors: Gerald E. Whittenburg, Martha Altus Buller, Steven L Gill
Posted Date:
Students also viewed these law questions
-
1. [10] Let A = 2 4 a b c d e f g h i 3 5, B = 2 4 d + 5g e+ 5h f+ 5i a 2g b 2h c 2i g h i 3 5, C = 2 4 2g 2h 2i 3d 3e 3f 1a 1b 1c 3 5. Suppose that det A = 5. Find det B = , det C = , and det (AC) =
-
Consider A-E, five mutually exclusive alternatives: A B C D E Initial cost $600 $600 $600 $600 $600 Uniform annual 100 100 100 150 150 Benefits for first 5 years 5 years 50 100 110 0 50 The interest...
-
A B C D E F G 1 Suppose the risk free interest rate is 4%. Calculate the following using the EXCEL functions. 2 3 Having $500 today is equivalent to having what amount in one year? 4 Present value...
-
At the end of Year 1, Clayton Company had $7,000 of cash, $8,500 land, $2,500 of liabilities, $4,000 of common stock, and $9,000 of retained earnings. During Year 2, Clayton experienced the following...
-
Look at the futures listings for the corn contract in Figure. a. Suppose you buy one contract for March delivery. If the contract closes in March at a level of 3.875, what will your profit be? b. How...
-
The formula Ï/n for the standard deviation of x actually is an approximation that treats the population size as infinitely large relative to the sample size n. The exact formula for a finite...
-
Do a search for a sample pleading format and see if you can find one for California.
-
Assume that you have been assigned to the audit of Keystone after audit planning has occurred. Review the planning information on pages 235242 and the audit program for the accounts receivable and...
-
The " ABCEasyAs123 " Corporation has numerous retail clothing stores in the Lower Mainland. Its tax rate is 40 percent. ABC is going to expand its business by building a new retail store in the Lower...
-
1. Identify where (in its value system) and how IKEA have achieved cost leadership. 2. Identify how IKEA have achieved differentiation from their competitors. 3. Explain how IKEA tries to ensure that...
-
Restaurant equipment purchased at a cost of $ 1 5 0 , 0 0 0 is to be depreciated by the double declining - balance method over 1 0 years. What is the book value of the equipment at the end of 6...
-
The current economic model is largely based on the conscious political and economic decisions of leaders from the 1960's. Boyer's text explains the specific decisions made by Governor Ralph...
-
Flounder Ltd., who owes Pharoah Corp. $603,000 in notes payable, is in financial difficulty. To eliminate the debt, Pharoah agrees to accept from Flounder land having a fair value of $456,800 and a...
-
Select two consecutive days (48 hours) where you will unplug from technology and not use the following electronic means for leisure: cell phones, television, internet, ipods, mp3 players, game...
-
Acknowledging that one size does not fit all applies to our contemporary workplace as it relates to the leadership style employed by organizational leaders. What complicates the need for an...
-
The following data from the just completed year are taken from the accounting records of Mason Company: Sales $ 6 5 4 , 0 0 0 Direct labor cost $ 8 9 , 0 0 0 Raw material purchases $ 1 3 3 , 0 0 0...
-
-28.1 x 10⁻⁶ C 91 Find the net force on 9. +25.5 x 10⁶ C + 92 0.300 m 0.300 m F = force exerted on 92 by 91 F3 = force exerted on 92 by 93 F3 = N [F= F = [?] N Remember: Like charges repel; opposite...
-
President Lee Coone has asked you to continue planning for an integrated corporate NDAS network. Ultimately, this network will link all the offices with the Tampa head office and become the...
-
The following additional information is available for the Dr. Ivan and Irene Incisor family from Chapters 1-6. On December 12, Irene purchased the building where her store is located. She paid...
-
Dr. George E. Beeper is a single taxpayer. He lives at 45 Mountain View Dr., Apt. 321, Spokane, WA 99210. Dr. Beeper's Social Security number is 775-88-9531. Dr. Beeper works for the Pine Medical...
-
Quince Corporation has taxable income of $450,000 for its 2012 calendar tax year. Calculate the corporation's income tax liability for 2012 before tax credits. $_________
-
If you could interview any historical figure who contributed to the development of the U.S. nonprofit sector, who would you choose, and why? What three questions would you most like to ask this...
-
Stephen Wernet has claimed that resources are the crucial link between operation and survival and that organizations change only when they experience a significant shift in resources. Do you agree or...
-
Of the different theoretical approaches to leadership, which one did the YSN board tend to rely on most in selecting an executive director for the agency? What are the likely consequences of...

Study smarter with the SolutionInn App