

Question: O Points 0 of 1 First create a scatter plot for the data in the table Then use the shape of the scatter plot given
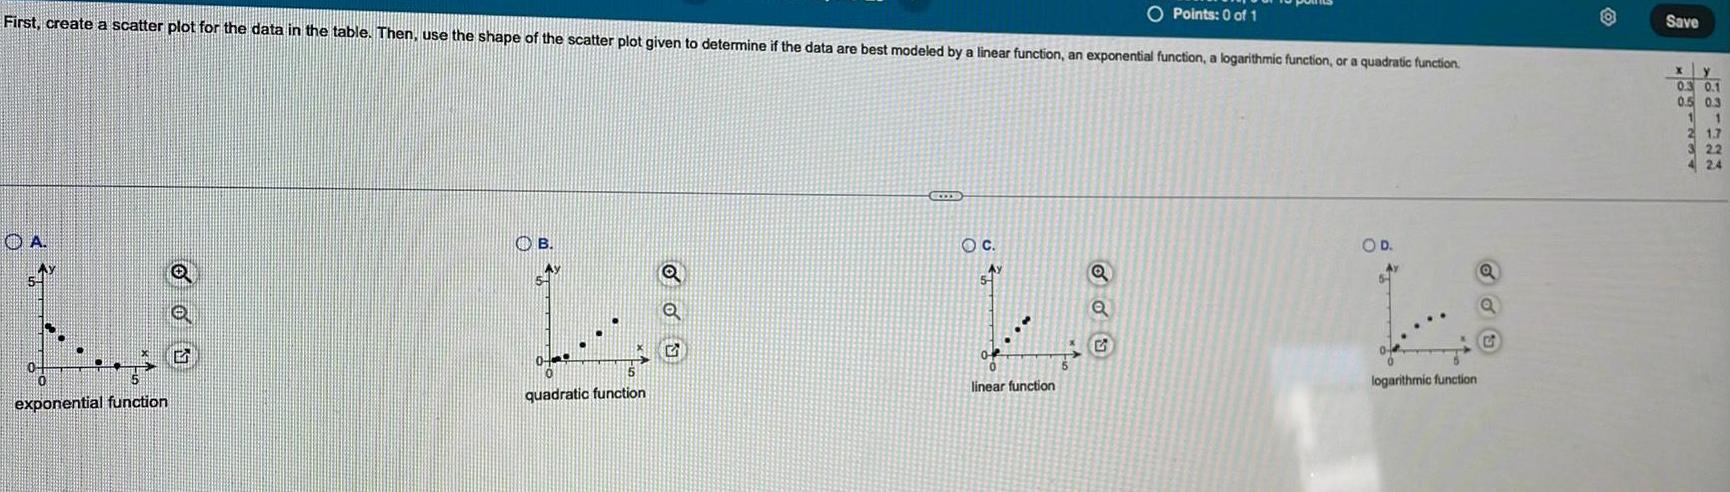

O Points 0 of 1 First create a scatter plot for the data in the table Then use the shape of the scatter plot given to determine if the data are best modeled by a linear function an exponential function a logarithmic function or a quadratic function A Ay 0 exponential function ou B 0 quadratic function Q G COD OC Ay linear function Q Q S O D logarithmic function Q C Save xy 0 3 0 1 0 5 0 3 2 1 7 2 2 2 4
Step by Step Solution
There are 3 Steps involved in it
1 Expert Approved Answer
Step: 1 Unlock

Question Has Been Solved by an Expert!
Get step-by-step solutions from verified subject matter experts
Step: 2 Unlock
Step: 3 Unlock