

Question: o Step 3: Record the Regression Output 4 The regression output will provide the coefficients (Jy, 51, Fa, F3, 54) and other statistics. Step 4:
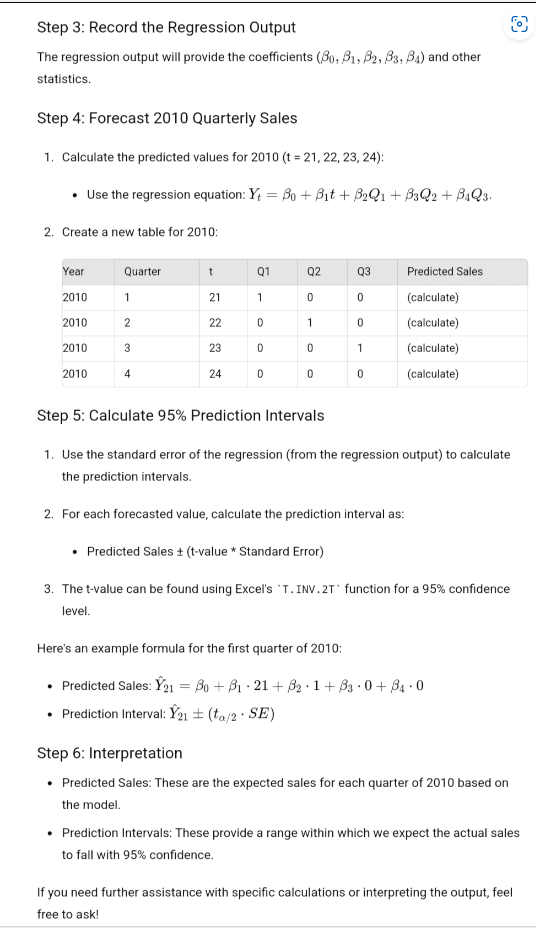
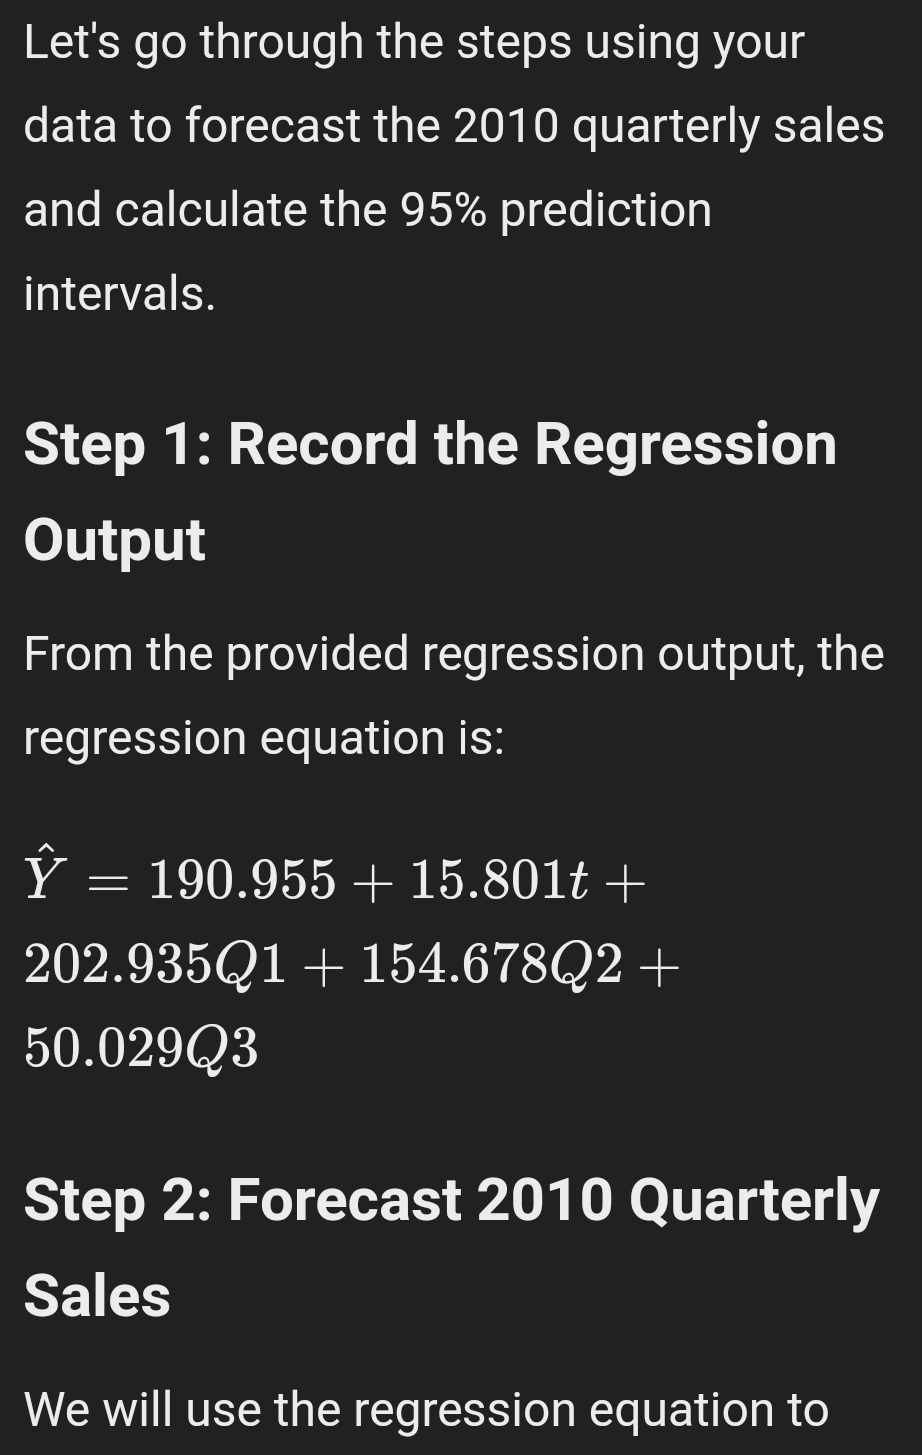
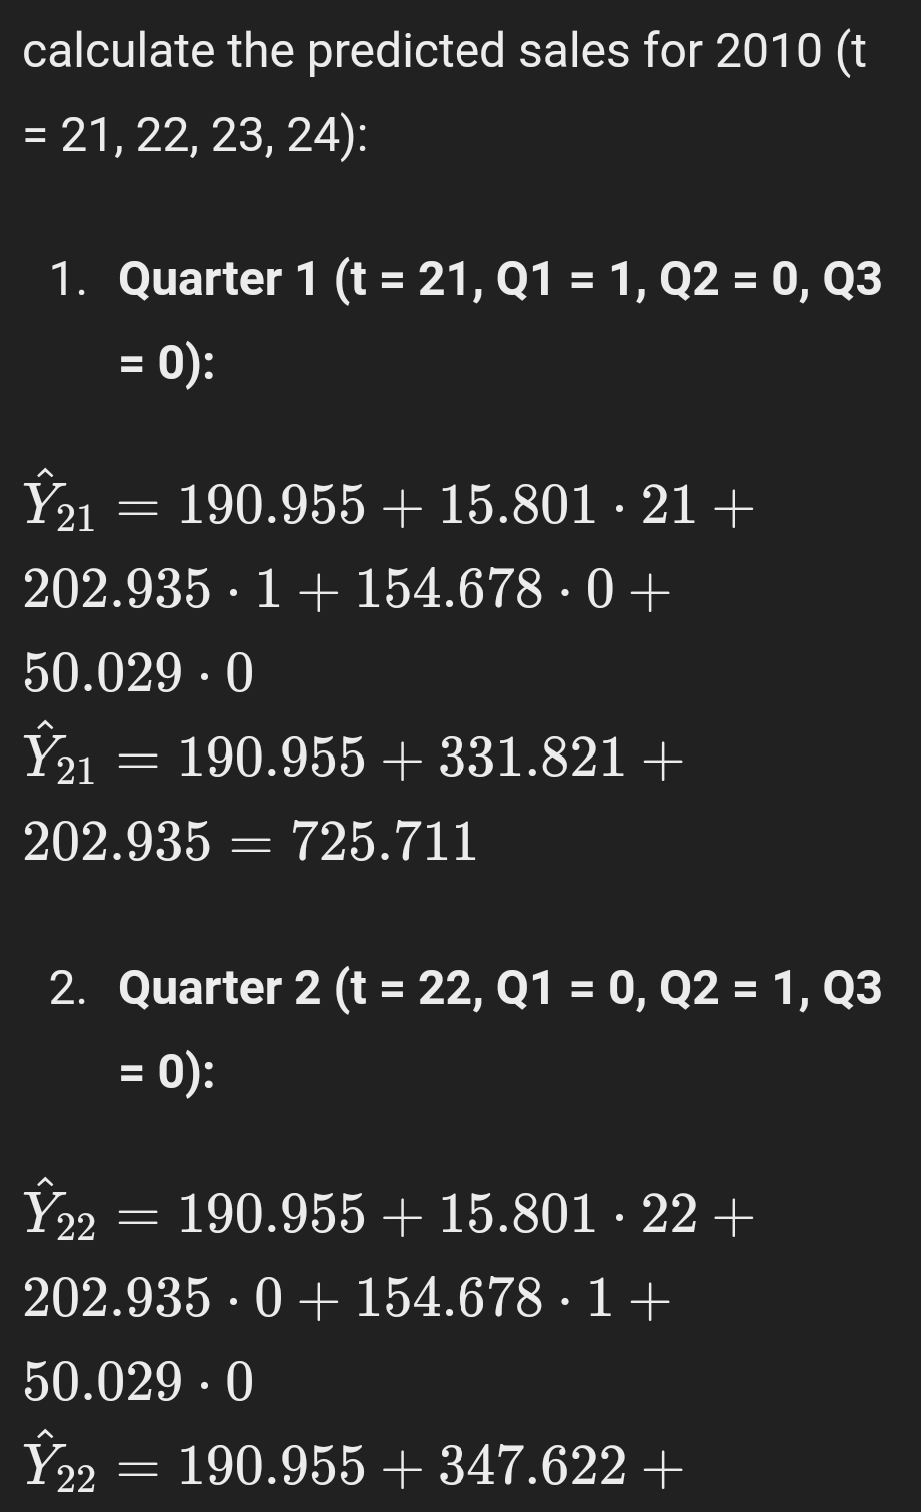
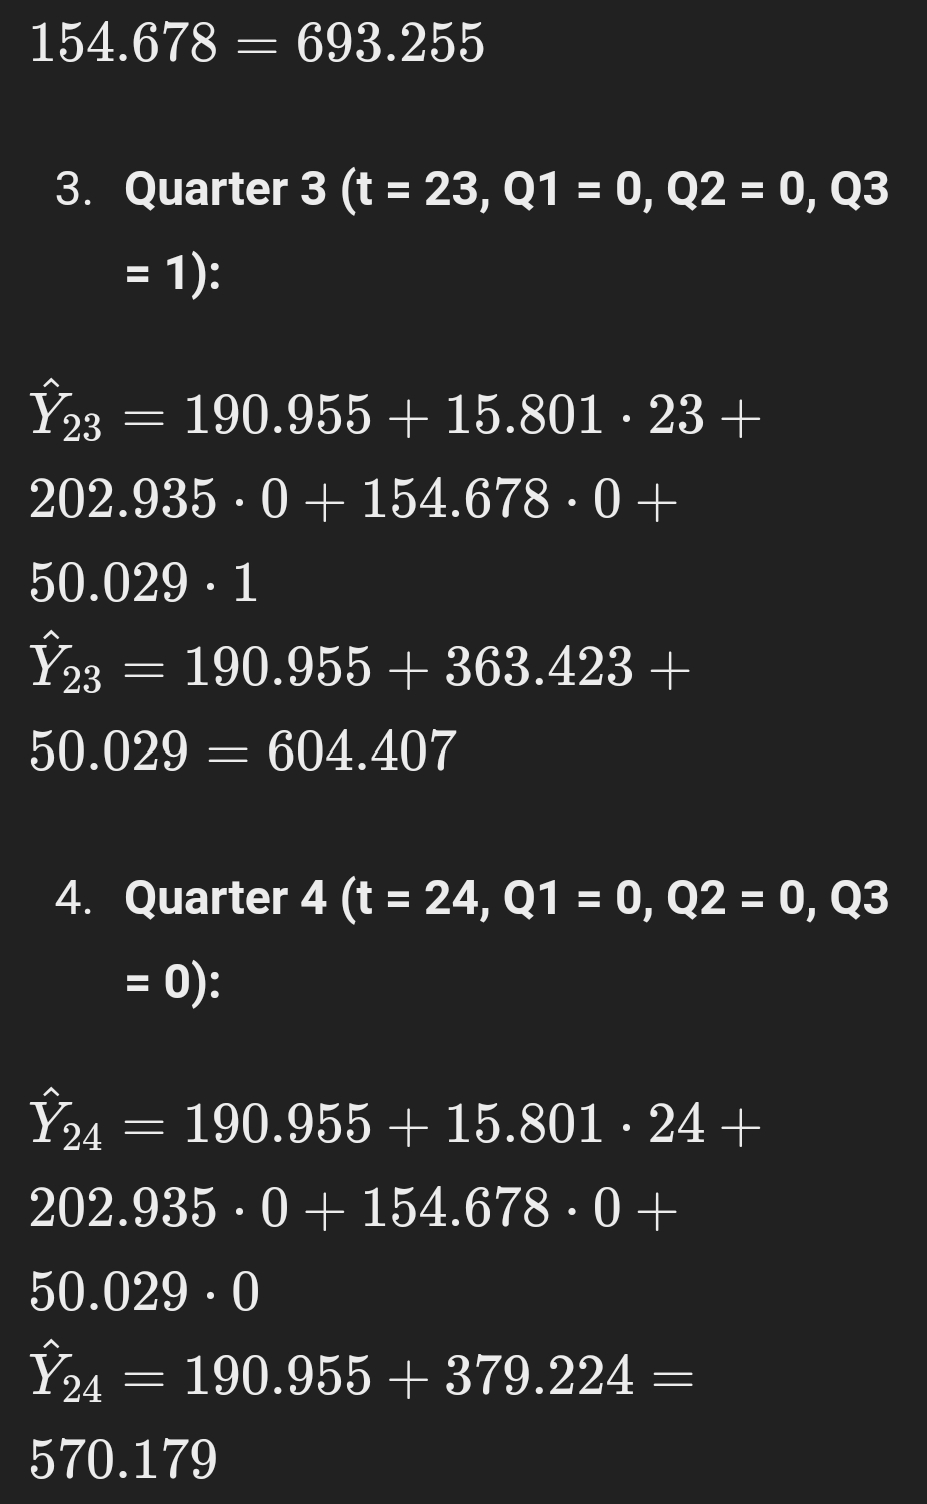
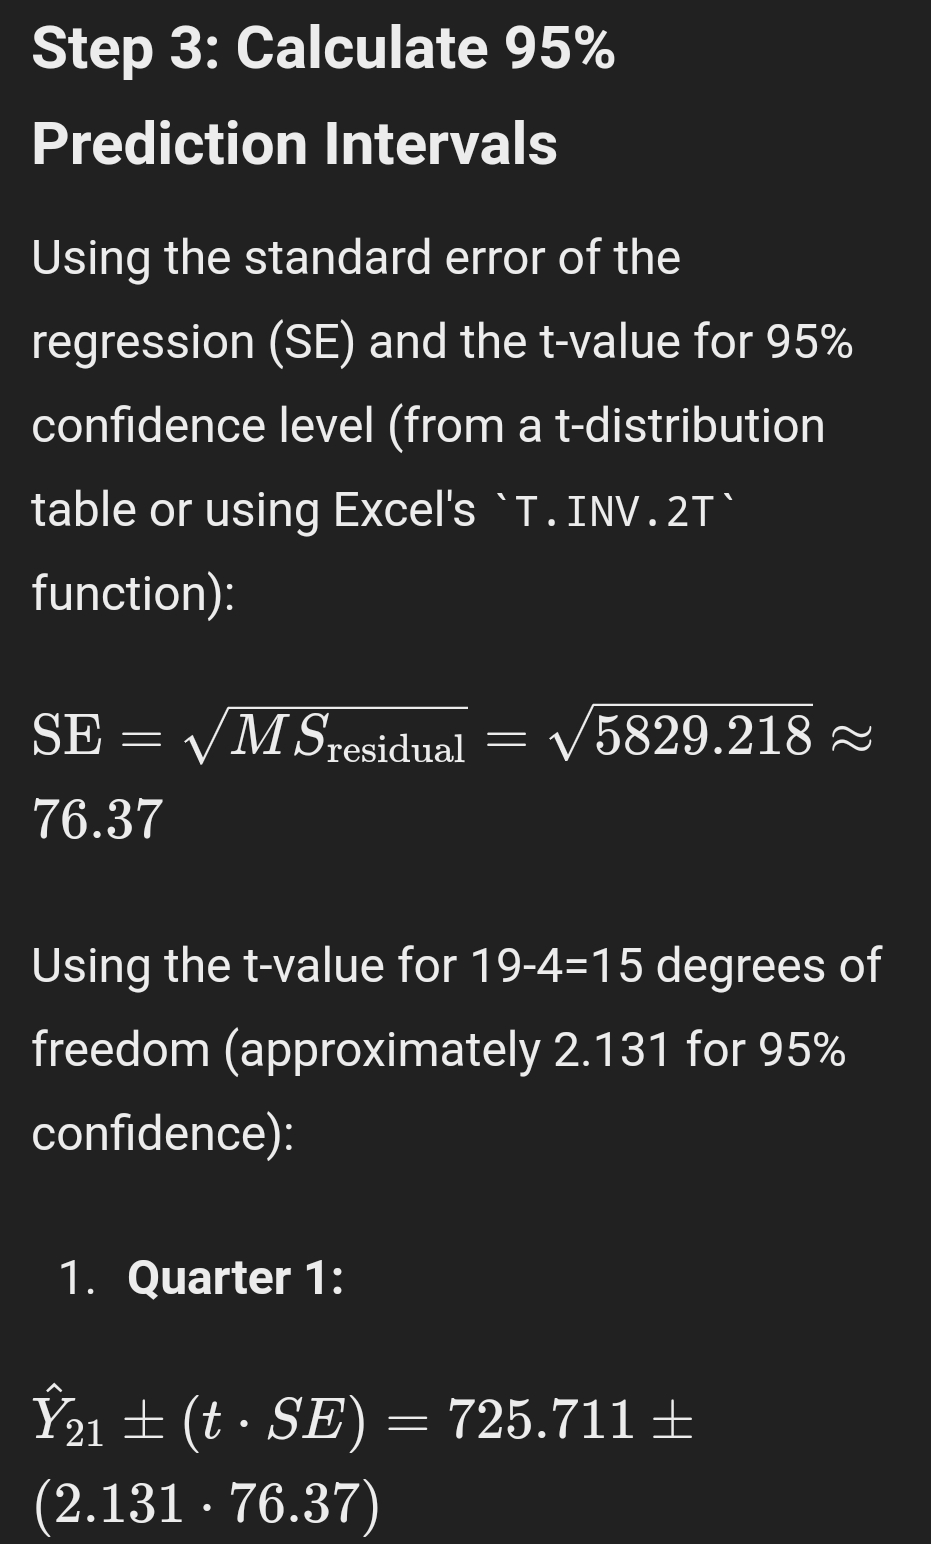
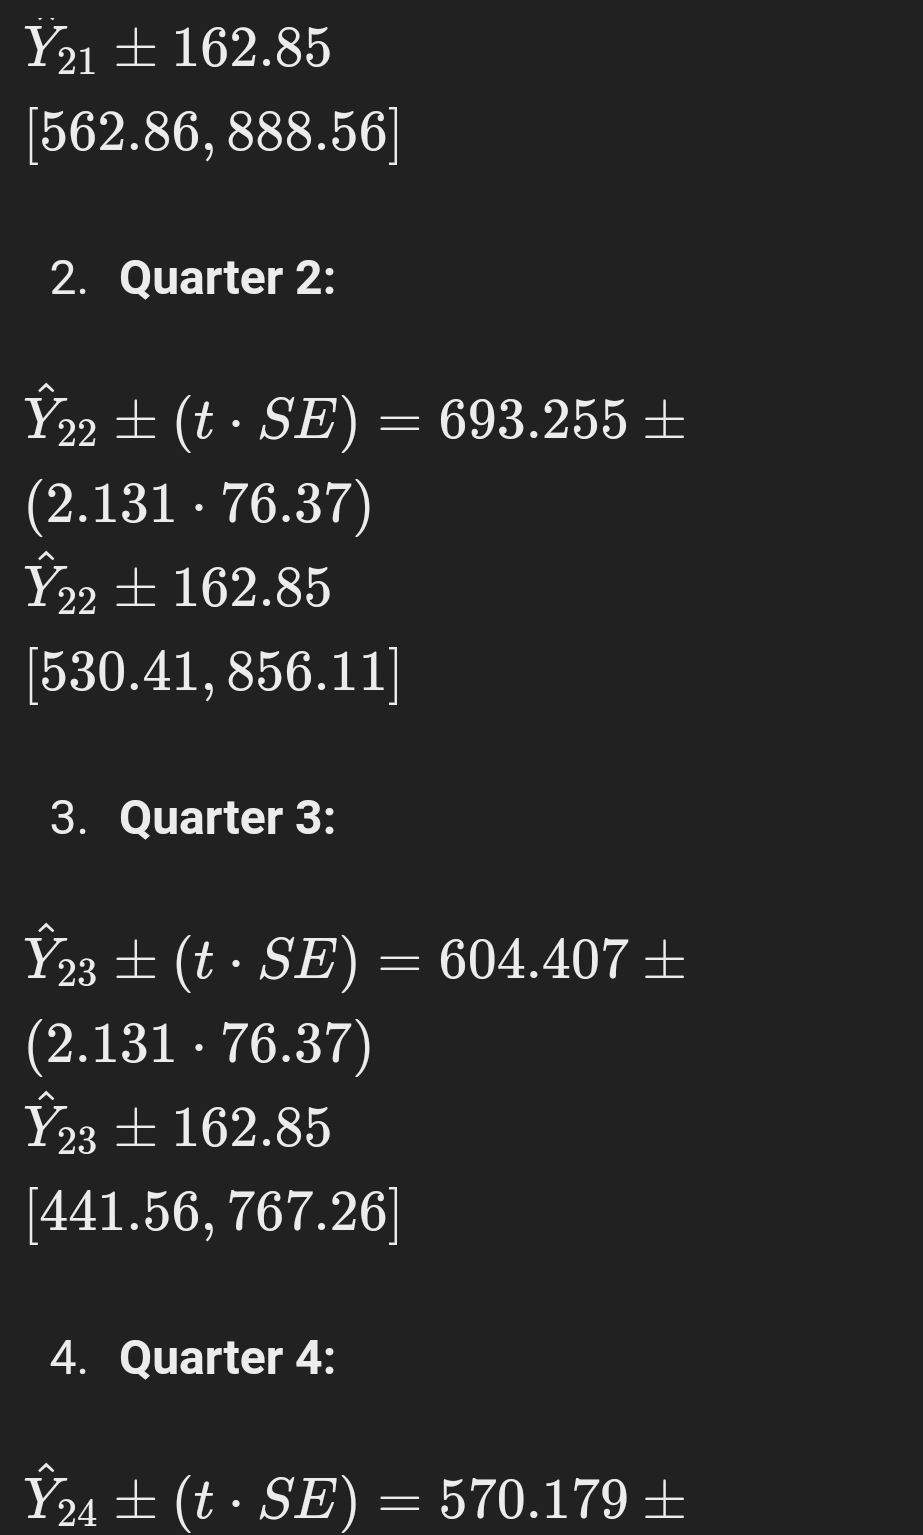
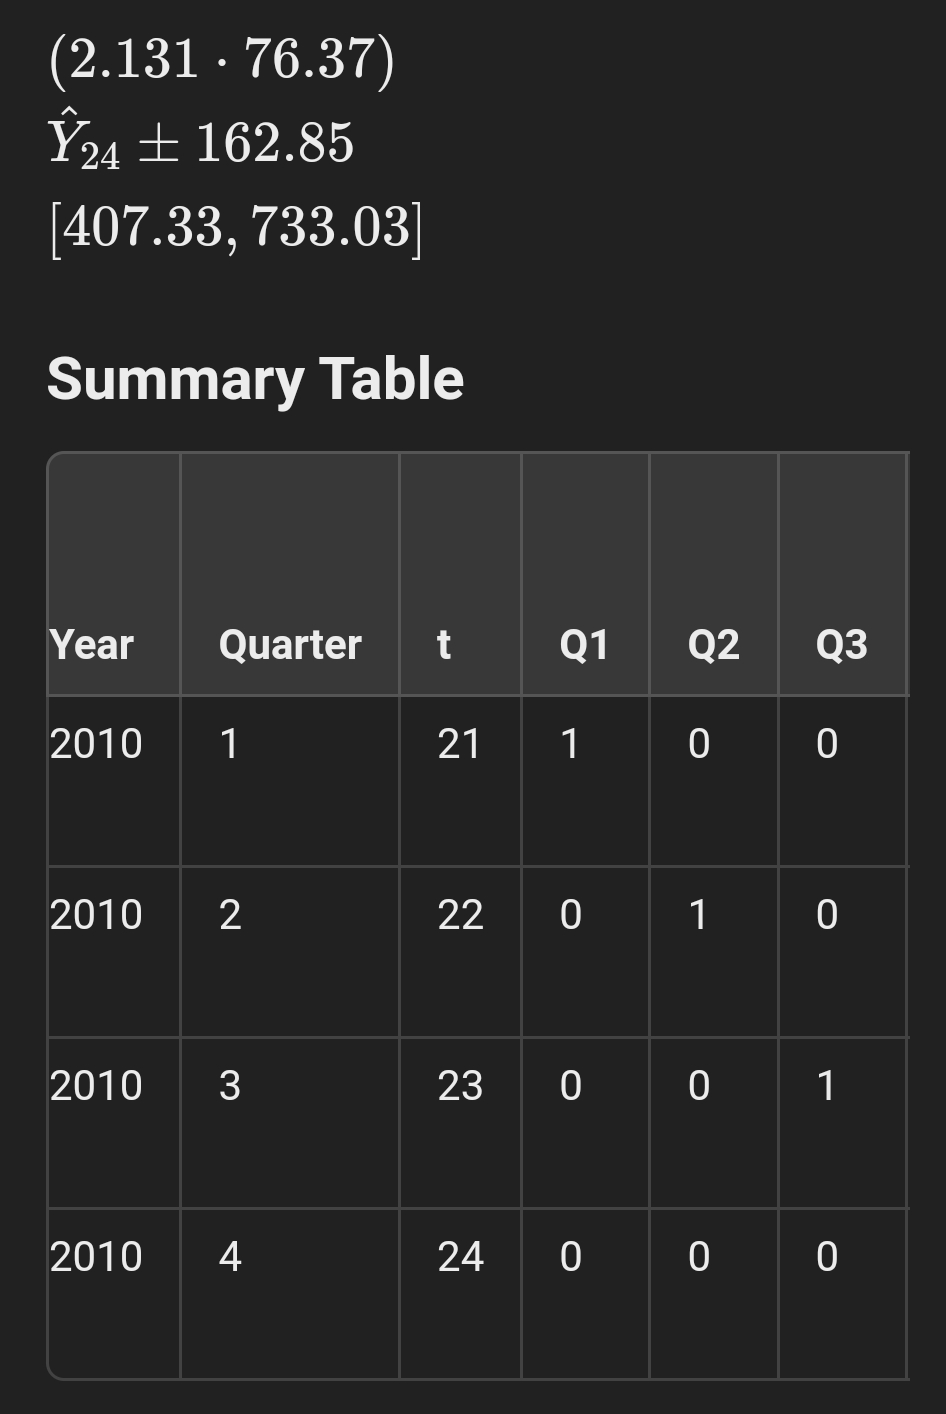
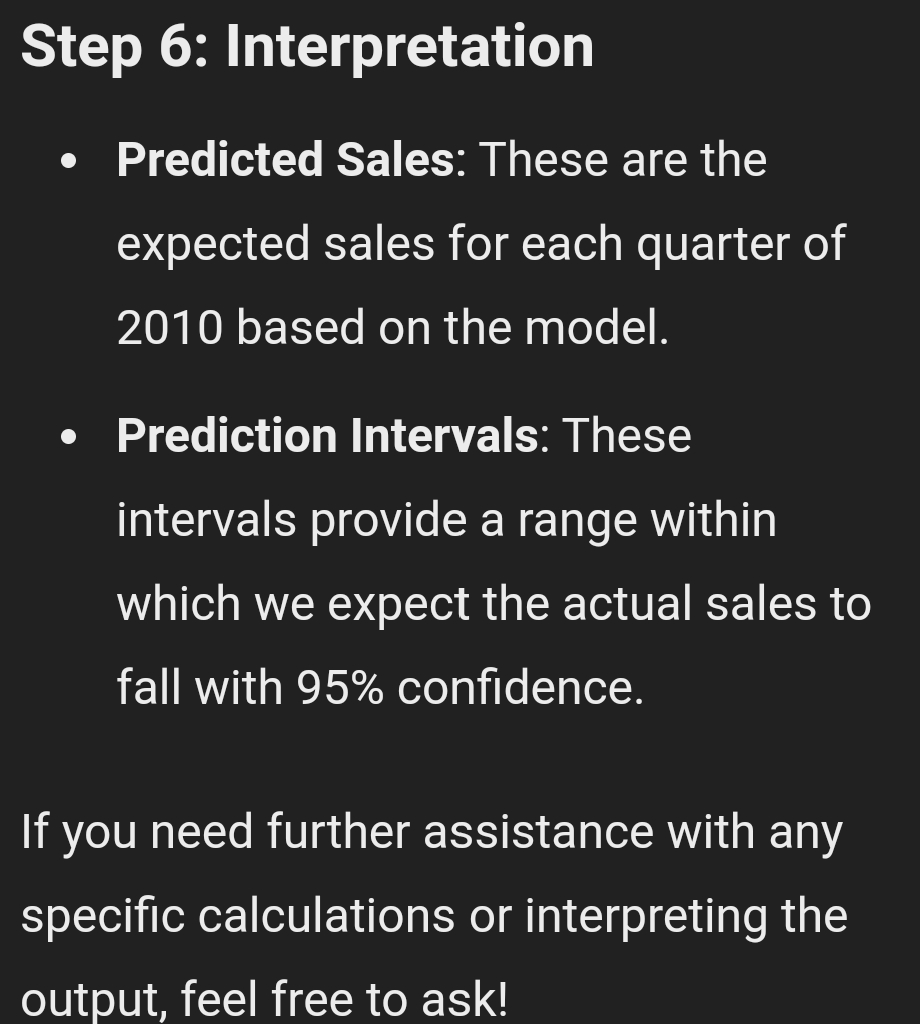
o Step 3: Record the Regression Output 4 The regression output will provide the coefficients (Jy, 51, Fa, F3, 54) and other statistics. Step 4: Forecast 2010 Quarterly Sales 1. Calculate the predicted values for 2010 (t =21, 22, 23, 24); = Use the regression equation: Y; = Sy + S1f + 5201 + 330G + 4G, 2. Create a new table for 2010 Year Quarter 1 a1 02 03 Predicted Sales 2010 1 2 1 0 0 (calculate) 2010 z 22 0 1 0 (calculate) 2010 3 23 0 0 1 (calculate) 2010 4 24 ] 0 0 (calculate) Step 5: Calculate 95% Prediction Intervals 1. Use the standard error of the regression (from the regression output) to calculate the prediction intervals. 2. For each forecasted value, calculate the prediction interval as: Predicted Sales 4 (t-value * Standard Error) 3. The t-value can be found using Excel's "T.INV.2T" function for a 95% confidence level. Here's an example formula for the first quarter of 2010; s Predicted Sales:'_r"m =M +5-21+5-14+8-04 840 - Prediction Interval: Ya; =+ (ta;2 - SE) Step 6: Interpretation = Predicted Sales: These are the expected sales for each guarter of 2010 based on the madel. Prediction Intervals: These provide a range within which we expect the actual sales to fall with 95% confidence. If you need further assistance with specific calculations or interpreting the output, feel free to ask! Let's go through the steps using your data to forecast the 2010 quarterly sales and calculate the 95% prediction intervals. Step 1: Record the Regression Output From the provided regression output, the regression equation is: Y = 190.955 + 15.801t + 202.935Q1 + 154.678Q2+ 50.029Q3 Step 2: Forecast 2010 Quarterly Sales We will use the regression equation to\f\fStep 3: Calculate 95% Prediction Intervals Using the standard error of the regression (SE) and the t-value for 95% confidence level (from a t-distribution table or using Excel's 'T . INV . 2T' function): SE = VM Sresidual = V 5829.218 ~ 76.37 Using the t-value for 19-4=15 degrees of freedom (approximately 2.131 for 95% confidence): 1. Quarter 1: Y21 + (t . SE) = 725.711 + (2.131 . 76.37)Y21 + 162.85 562.86, 888.56 2. Quarter 2: Y22 + (t . SE) = 693.255 + (2.131 . 76.37) Y22 + 162.85 [530.41, 856.11] 3. Quarter 3: Y23 + (t . SE) = 604.407 + (2.131 . 76.37) Y23 + 162.85 [441.56, 767.26] 4. Quarter 4: Y24 + (t . SE) = 570.179 +\fStep 6: Interpretation e Predicted Sales: These are the expected sales for each quarter of 2010 based on the model. Prediction Intervals: These intervals provide a range within which we expect the actual sales to fall with 95% confidence. If you need further assistance with any specific calculations or interpreting the output, feel free to ask
Step by Step Solution
There are 3 Steps involved in it

Get step-by-step solutions from verified subject matter experts