

Question: ( O ' Sullivan , 1 0 . 2 ) Consider the following table: Volume Trip Time Increase in Travel Time per Driver Increase in
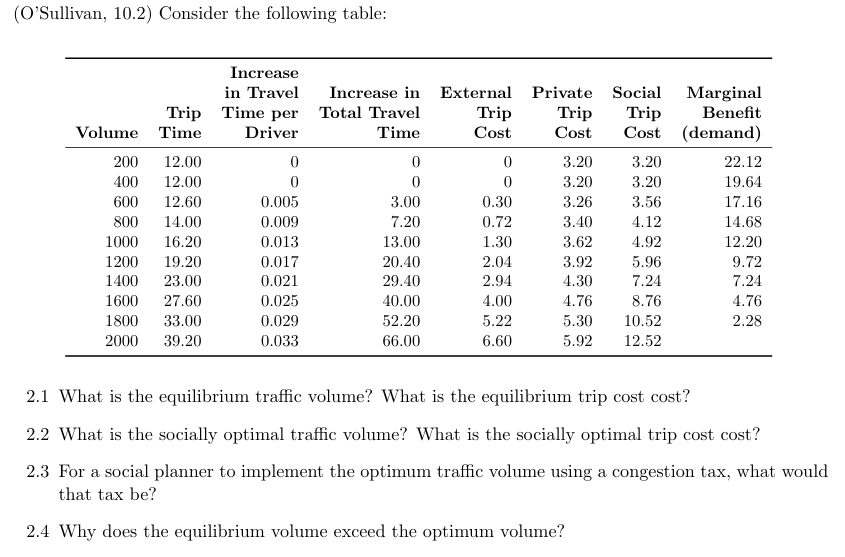
OSullivan Consider the following table:
Volume
Trip Time
Increase in Travel Time per Driver Increase in Total Travel Time
External Trip Cost
Private Trip Cost
Social Trip Cost
Marginal Benefit demand
What is the equilibrium traffic volume? What is the equilibrium trip cost cost?
What is the socially optimal traffic volume? What is the socially optimal trip cost cost?
For a social planner to implement the optimum traffic volume using a congestion tax, what would that tax be
Why does the equilibrium volume exceed the optimum volume?
Step by Step Solution
There are 3 Steps involved in it
1 Expert Approved Answer
Step: 1 Unlock

Question Has Been Solved by an Expert!
Get step-by-step solutions from verified subject matter experts
Step: 2 Unlock
Step: 3 Unlock