

Question: O The frequency distribution was obtained using a class width of 0.5 for data on cigarette tax rates. Use the frequency distribution to approximate
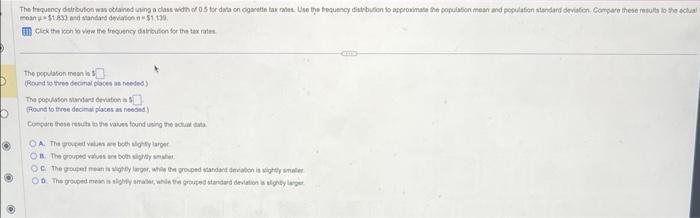
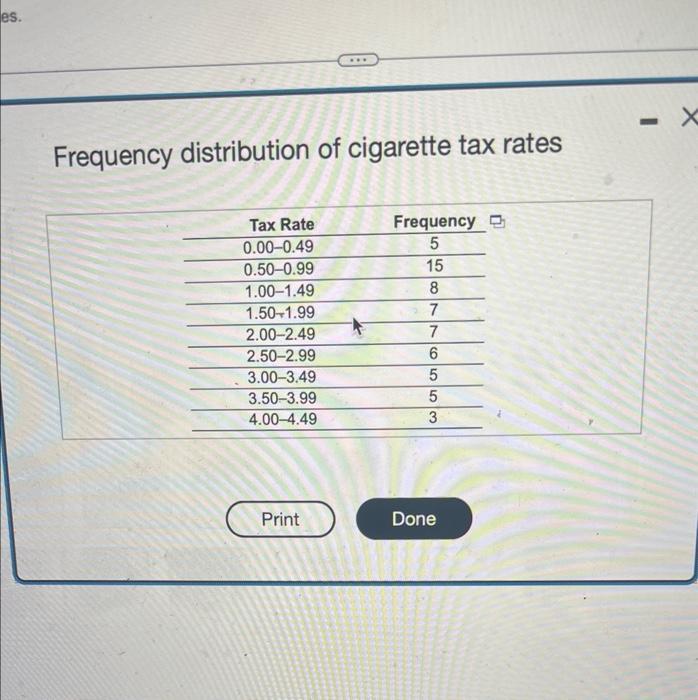
O The frequency distribution was obtained using a class width of 0.5 for data on cigarette tax rates. Use the frequency distribution to approximate the population mean and population standard deviation Compare these results to the actual mean $1.833 and standard deviation $1,139 Click the icon to view the frequency distribution for the tax rates The population mean is (Round to three decimal places as needed) The population standard deviation is (Round to three decimal places as needed) Compare these results to the values found using the actual data OA. The grouped values are both slightly larger OB. The grouped values are both slightly smar OC The grouped mean is slightly larger, while the grouped standant deviation is slightly smal OD The grouped mean is slightly smaller, while the grouped standard deviation is sighty larger es. Frequency distribution of cigarette tax rates Tax Rate 0.00-0.49 0.50-0.99 1.00-1.49 1.50 1.99 2.00-2.49 2.50-2.99 3.00-3.49 3.50-3.99 4.00-4.49 Print Frequency 5 15 8 7 7 6 55 5 5 3 Done - X
Step by Step Solution
3.55 Rating (165 Votes )
There are 3 Steps involved in it
frequency distribution of cigarette tax rate class ... View full answer

Get step-by-step solutions from verified subject matter experts