

Question: O unit7 {2).pdf C' Q 1. Use our discrete model for a xed rate mortgage to answer the following questions. Our model is Mk+1 =
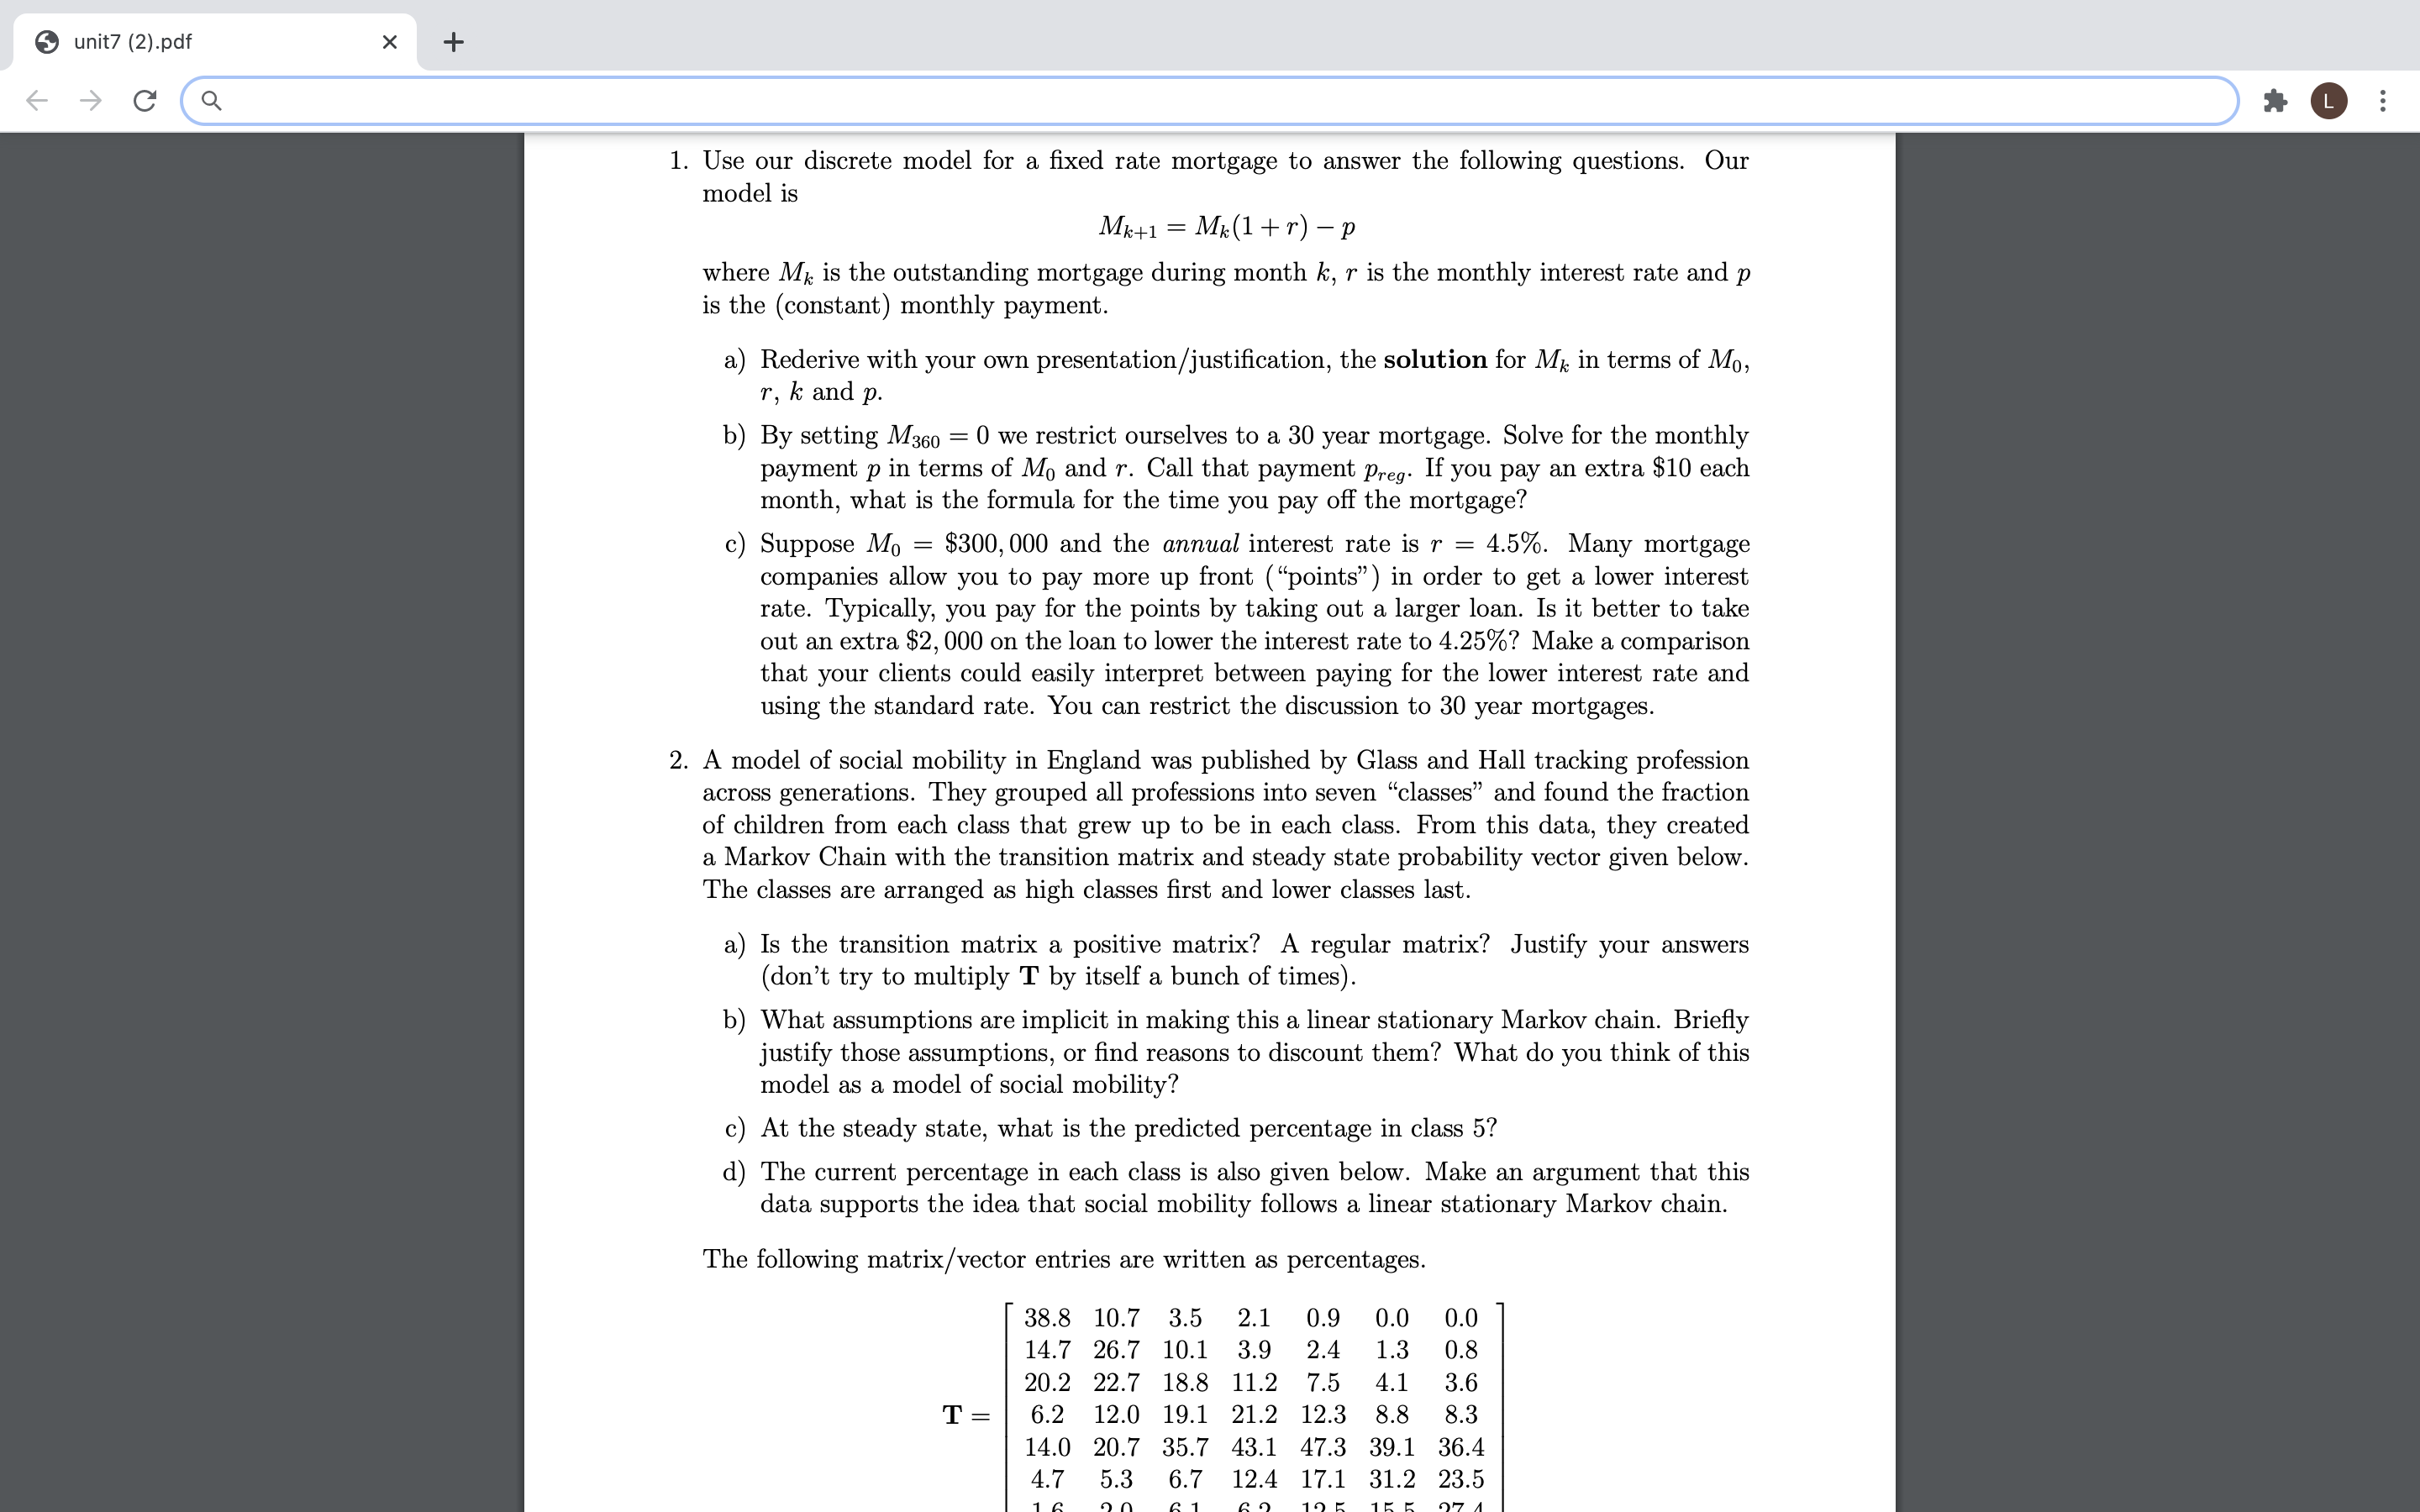
O unit7 {2).pdf C' Q 1. Use our discrete model for a xed rate mortgage to answer the following questions. Our model is Mk+1 = Mk(1+'\") '17 where Mk is the outstanding mortgage during month k, r is the monthly interest rate and p is the (constant) monthly payment. a) Rederive with your own presentation/justication, the solution for Mk in terms of M0, 'r, k and p. b) By setting M360 = 0 we restrict ourselves to a 30 year mortgage. Solve for the monthly payment p in terms of M0 and r. Call that payment prey. If you pay an extra $10 each month, what is the formula for the time you pay off the mortgage? c) Suppose M0 : $300,000 and the annual interest rate is r : 4.5%. Many mortgage companies allow you to pay more up front (\"points\") in order to get a lower interest rate. Typically, you pay for the points by taking out a larger loan. Is it better to take out an extra $2, 000 on the loan to lower the interest rate to 4.25%? Make a comparison that your clients could easily interpret between paying for the lower interest rate and using the standard rate. You can restrict the discussion to 30 year mortgages. 2. A model of social mobility in England was published by Glass and Hall tracking profession across generations They grouped all professions into seven \"classes\" and found the fraction of children from each class that grew up to be in each class. From this data, they created a Markov Chain with the transition matrix and steady state probability vector given below. The classes are arranged as high classes rst and lower classes last. a) Is the transition matrix a positive matrix? A regular matrix? Justify your answers (don't try to multiply T by itself a bunch of times). b) What assumptions are implicit in making this a linear stationary Markov chain. Briey justify those assumptions, or nd reasons to discount them? What do you think of this model as a model of social mobility? c) At the steady state, what is the predicted percentage in class 5? d) The current percentage in each class is also given below. Make an argument that this data supports the idea that social mobility follows a linear stationary Markov chain. The following matrix/ vector entries are written as percentages. 38.8 10.7 3.5 2.1 0.9 0,0 0.0 14.7 26.7 10.1 3.9 2.4 1.3 0.8 20.2 22.7 18.8 11.2 7.5 4.1 3.6 T = 6.2 12.0 19.1 21.2 12,3 8,8 8.3 14.0 20.7 35.7 43.1 47.3 39.1 36.4 4.7 5,3 6.7 12.4 17.1 31,2 23.5 1:: on 21 an 1r): 1:: 07A
Step by Step Solution
There are 3 Steps involved in it

Get step-by-step solutions from verified subject matter experts