

Question: o. Using the equations in Table 1, solve algebraically for the numerical values needed to fill in Table ) below. Table 3: Post-trade Production and
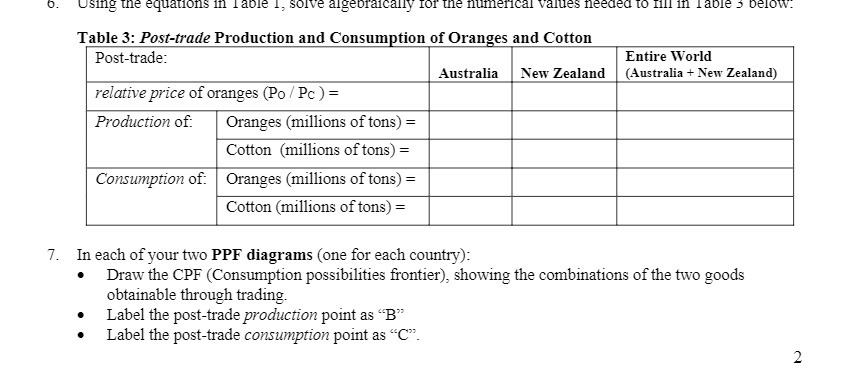
o. Using the equations in Table 1, solve algebraically for the numerical values needed to fill in Table ) below. Table 3: Post-trade Production and Consumption of Oranges and Cotton Post-trade: Entire World Australia New Zealand (Australia + New Zealand) relative price of oranges (Po / Pc ) = Production of: Oranges (millions of tons) = Cotton (millions of tons) = Consumption of: Oranges (millions of tons) = Cotton (millions of tons) = 7. In each of your two PPF diagrams (one for each country): . Draw the CPF (Consumption possibilities frontier), showing the combinations of the two goods obtainable through trading. Label the post-trade production point as "B" . Label the post-trade consumption point as "C". 2
Step by Step Solution
There are 3 Steps involved in it

Get step-by-step solutions from verified subject matter experts