

Question: O11. The graph below is the first derivative function c' for the function c. a. For what values is function c increasing? How do you

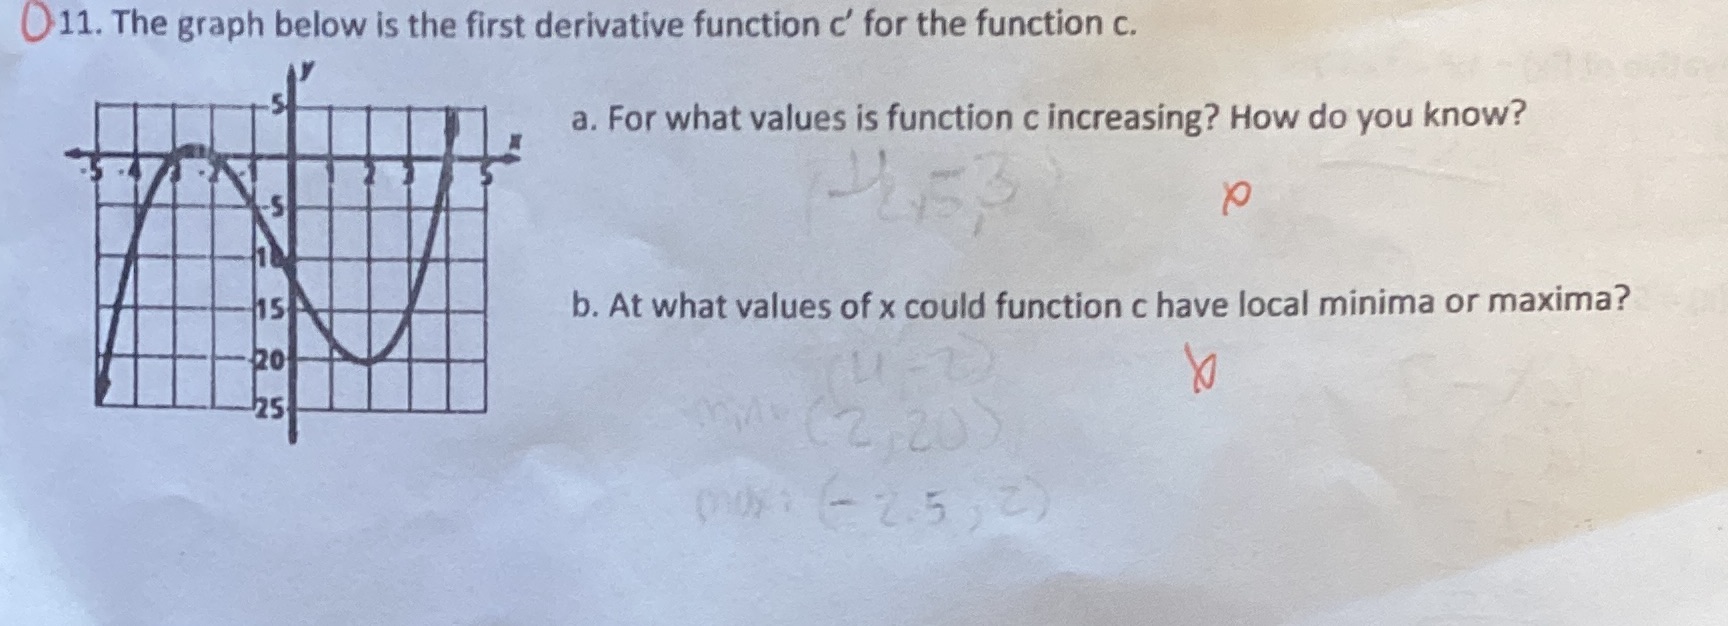
O11. The graph below is the first derivative function c' for the function c. a. For what values is function c increasing? How do you know? b. At what values of x could function c have local minima or maxima? X 25 mine(2 20 ) mor ( - 25 , 2)
Step by Step Solution
There are 3 Steps involved in it
1 Expert Approved Answer
Step: 1 Unlock

Question Has Been Solved by an Expert!
Get step-by-step solutions from verified subject matter experts
Step: 2 Unlock
Step: 3 Unlock