

Question: Ob both uper data is from Baddriverwork sheet and the destination to build the pivot table is an empty work sheet called Distracted Driving, now
 Ob
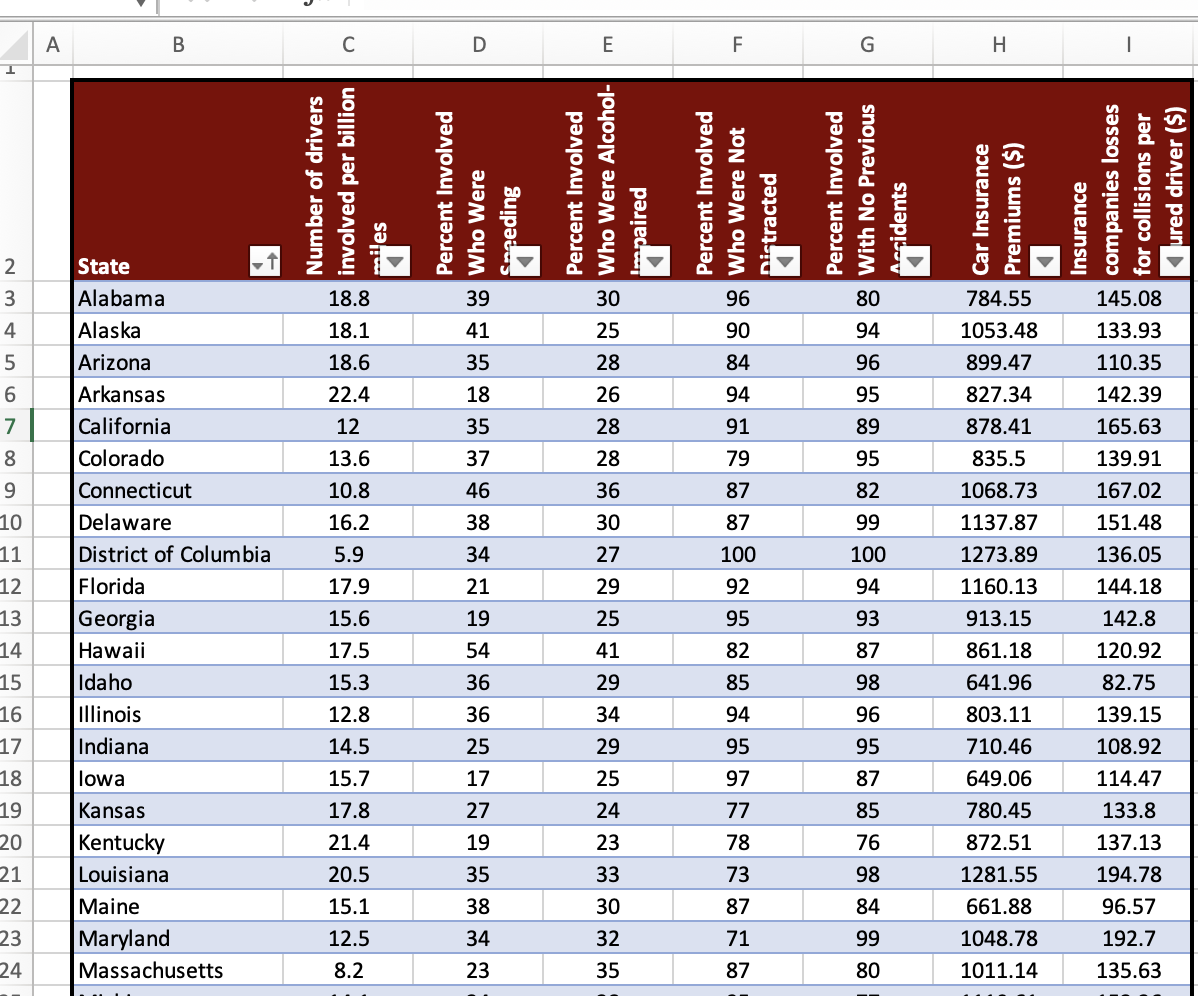
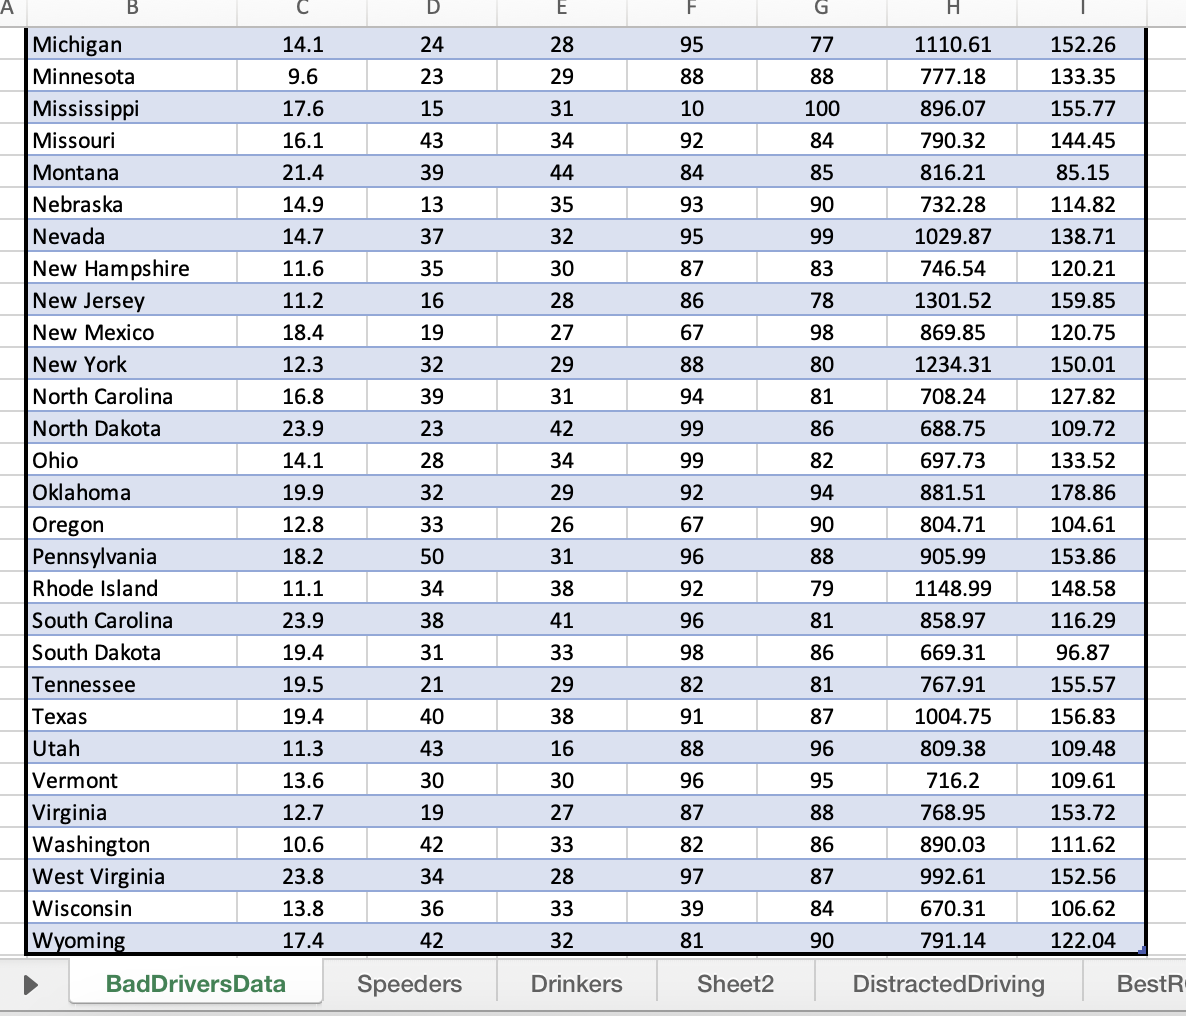
Ob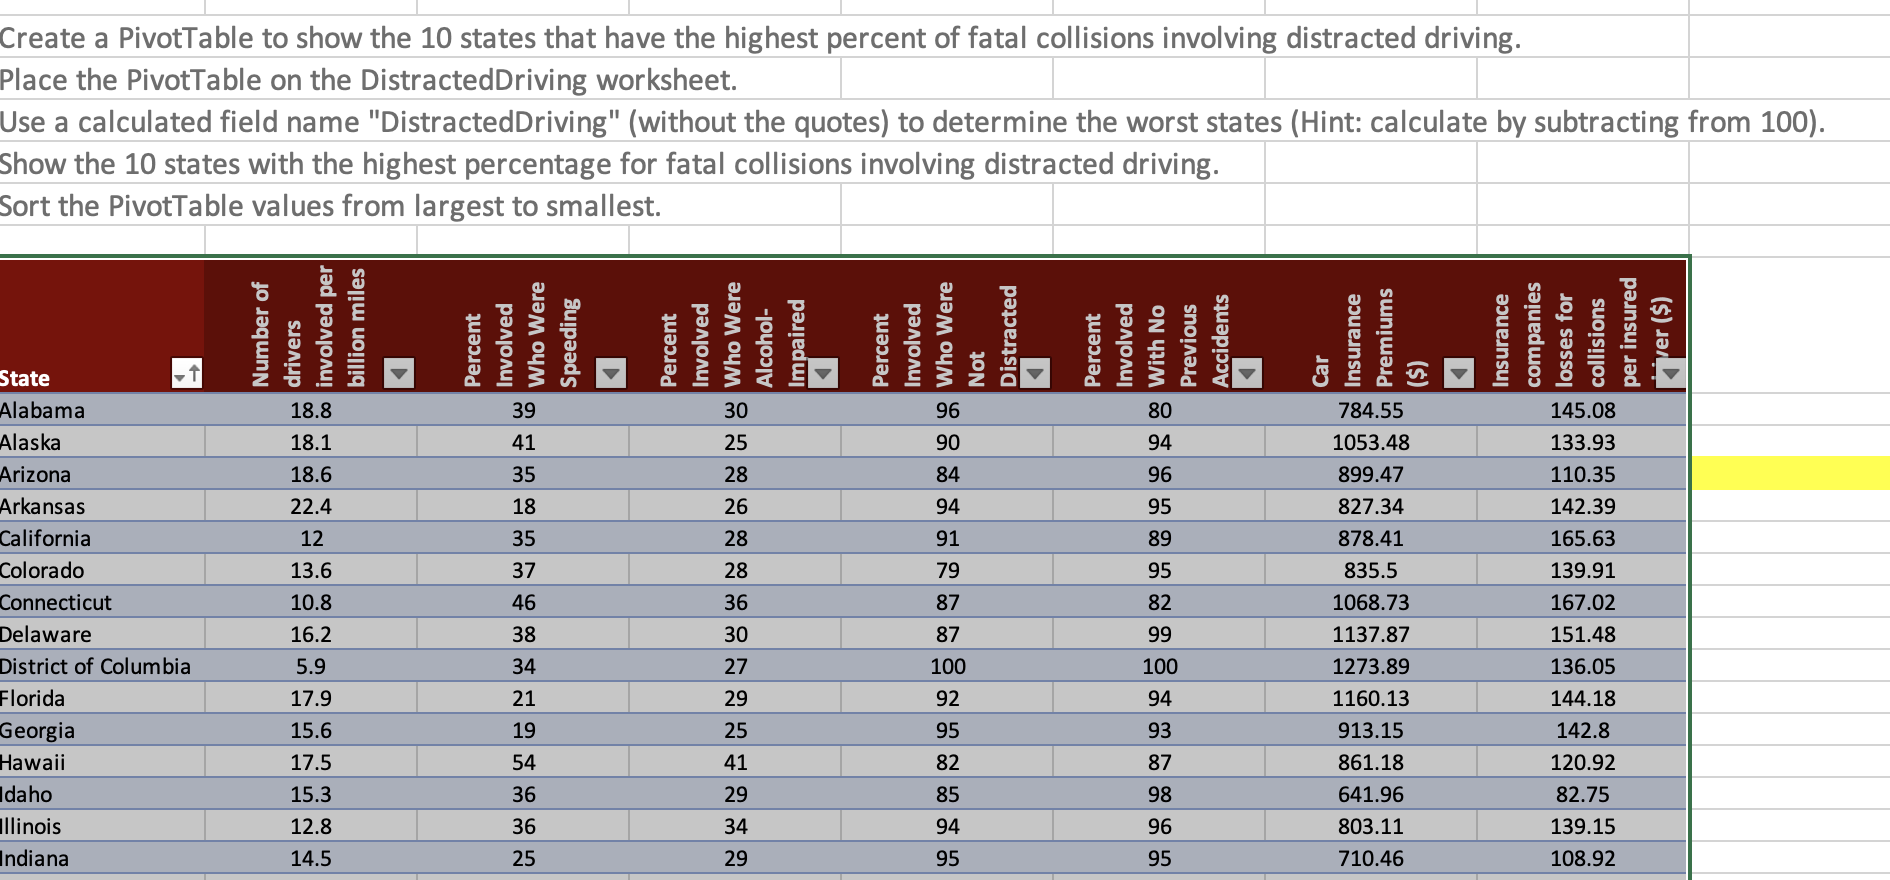 both uper data is from Baddriverwork sheet and the destination to build the pivot table is an empty work sheet called Distracted Driving, now needed to follow the question given above to build the pivot table , this is what it is, thanks
Create a PivotTable to show the 10 states that have the highest percent of fatal collisions involving distracted driving. Place the PivotTable on the DistractedDriving worksheet. Use a calculated field name "DistractedDriving" (without the quotes) to determine the worst states (Hint: calculate by subtracting from 100). Show the 10 states with the highest percentage for fatal collisions involving distracted driving. Sort the PivotTable values from largest to smallest. Create a PivotTable to show the 10 states that have the highest percent of fatal collisions involving distracted driving. Place the PivotTable on the DistractedDriving worksheet. Use a calculated field name "DistractedDriving" (without the quotes) to determine the worst states (Hint: calculate by subtracting from 100). Show the 10 states with the highest percentage for fatal collisions involving distracted driving. Sort the PivotTable values from largest to smallest
Step by Step Solution
There are 3 Steps involved in it

Get step-by-step solutions from verified subject matter experts