

Question: Objective 9a A student was asked a question about the probability of a bouncy castle being over its weight limit of 405 pounds if nine
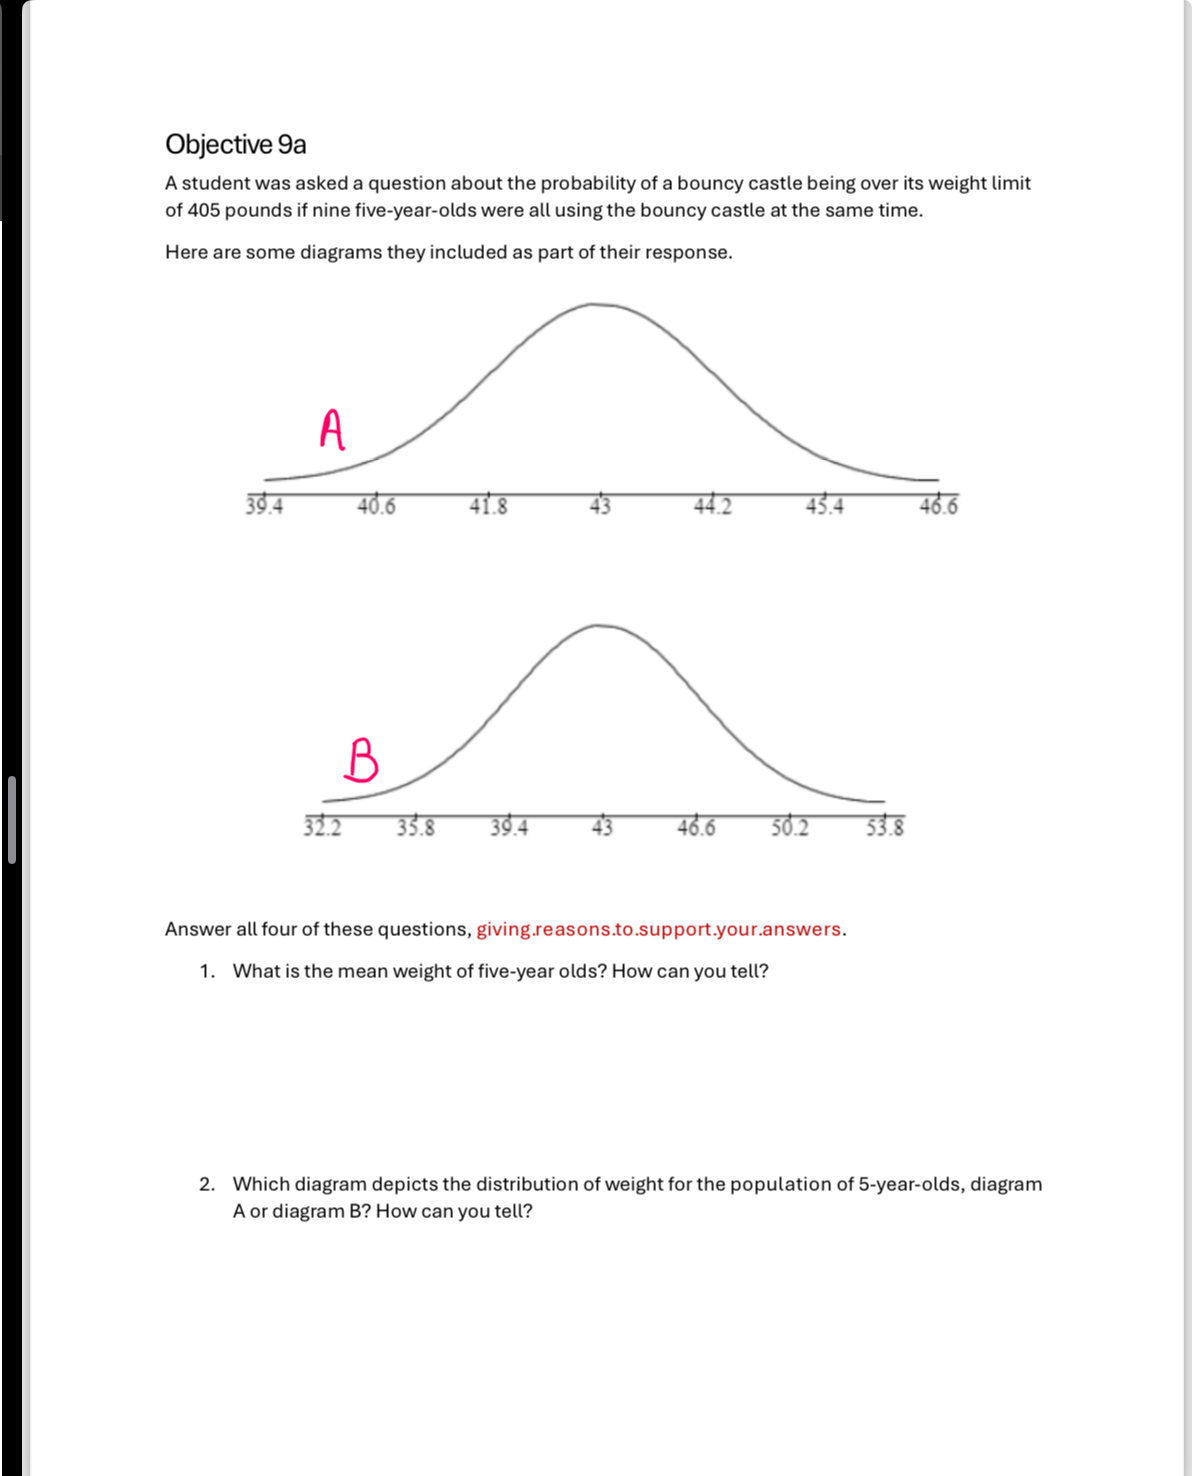
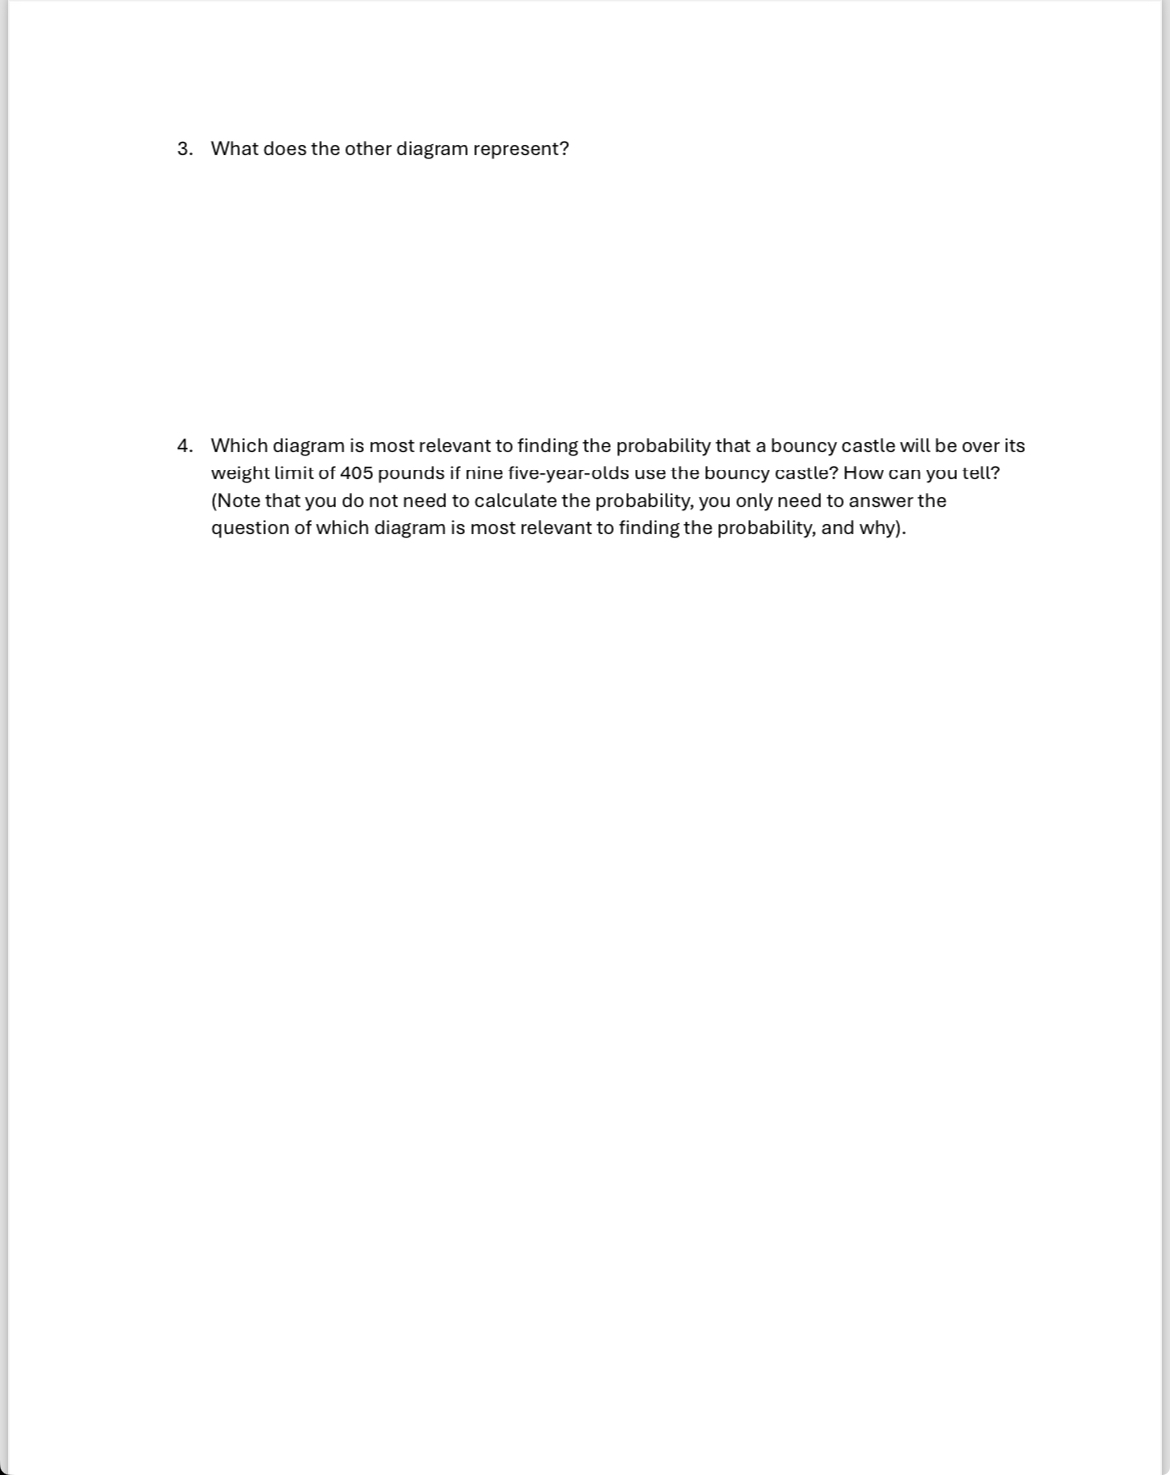
Objective 9a A student was asked a question about the probability of a bouncy castle being over its weight limit of 405 pounds if nine five-year-olds were all using the bouncy castle at the same time. Here are some diagrams they included as part of their response. 335 3 o b 4= O O Answer all four of these questions, giving reasons.to.support.your.answers. 1. What is the mean weight of five-year olds? How can you tell? 2. Which diagram depicts the distribution of weight for the population of 5-year-olds, diagram A or diagram B? How can you tell? 3. What does the other diagram represent? 4. Which diagram is most relevant to finding the probability that a bouncy castle will be over its weight limit of 405 pounds if nine five-year-olds use the bouncy castle? How can you tell? (Note that you do not need to calculate the probability, you only need to answer the question of which diagram is most relevant to finding the probability, and why)
Step by Step Solution
There are 3 Steps involved in it

Get step-by-step solutions from verified subject matter experts