

Question: Objective: Program a sequential process in VBA. Statistical process control charts are used to help control processes ( see example in Figure 1 ) .
Objective: Program a sequential process in VBA.
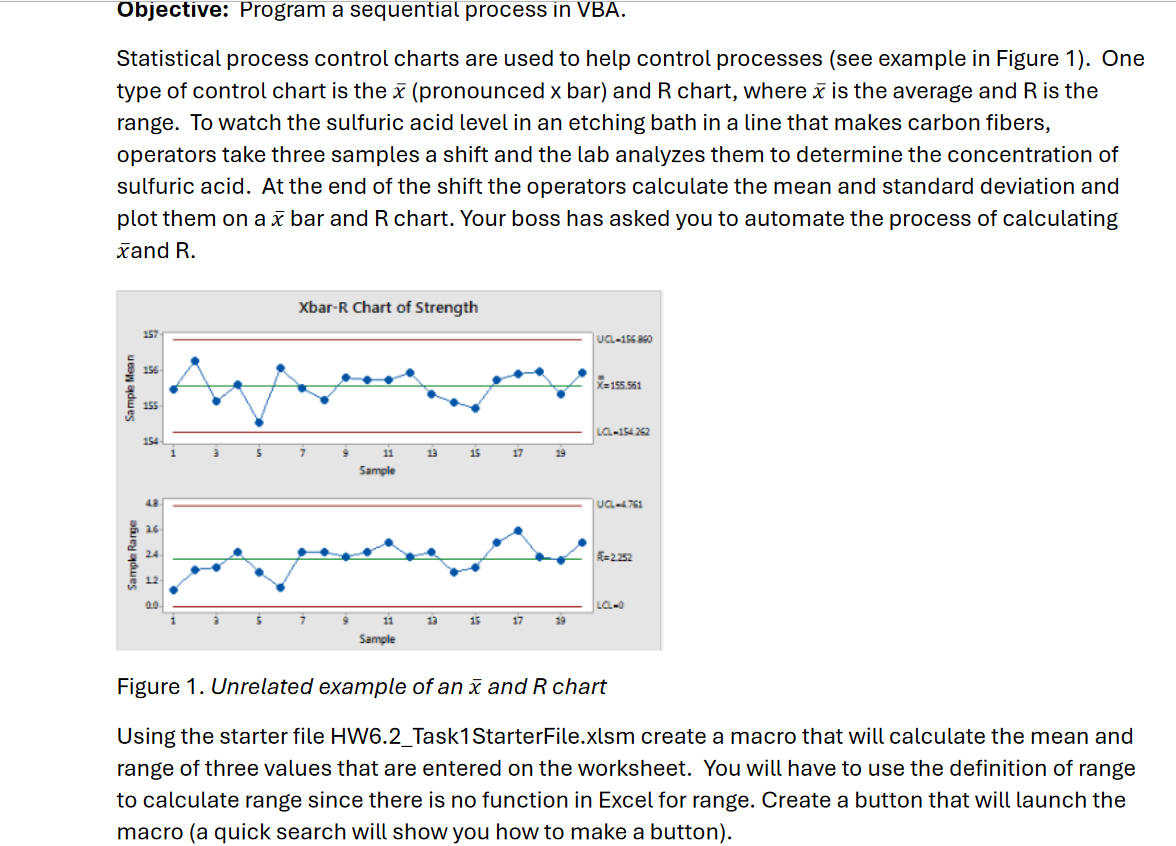
Statistical process control charts are used to help control processes see example in Figure One
type of control chart is the pronounced xbar and R chart, where is the average and R is the
range. To watch the sulfuric acid level in an etching bath in a line that makes carbon fibers,
operators take three samples a shift and the lab analyzes them to determine the concentration of
sulfuric acid. At the end of the shift the operators calculate the mean and standard deviation and
plot them on a bar and R chart. Your boss has asked you to automate the process of calculating
and R
Figure Unrelated example of an and chart
Using the starter file HWTaskStarterFile.xlsm create a macro that will calculate the mean and
range of three values that are entered on the worksheet. You will have to use the definition of range
to calculate range since there is no function in Excel for range. Create a button that will launch the
macro a quick search will show you how to make a button
Step by Step Solution
There are 3 Steps involved in it
1 Expert Approved Answer
Step: 1 Unlock

Question Has Been Solved by an Expert!
Get step-by-step solutions from verified subject matter experts
Step: 2 Unlock
Step: 3 Unlock