

Question: Objective: To demonstrate knowledge of how to use the functions related to the normal distribution in Matlab You should work on this task individually Write
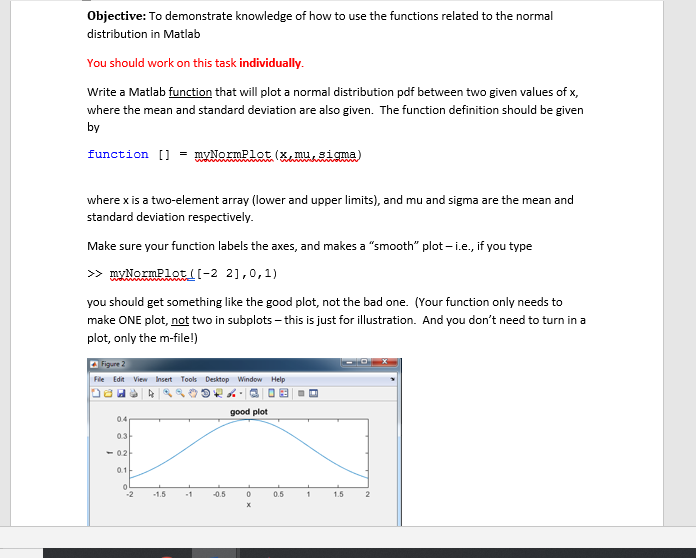
Objective: To demonstrate knowledge of how to use the functions related to the normal distribution in Matlab You should work on this task individually Write a Matlab function that will plot a normal distribution pdf between two given values of x, where the mean and standard deviation are also given. The function definition should be given by function [] myNormPlot (x,mu314ma) = where x is a two-element array (lower and upper limits), and mu and sigma are the mean and standard deviation respectively. Make sure your function labels the axes, and makes a "smooth" plot-i.e., if you type >>mvlomEletI-2 2],0,1) you should get something like the good plot, not the bad one. (Your function only needs to make ONE plot, not two in subplots- this is just for illustration. And you don't need to turn in a plot, only the m-file!) Fle Ede View Insert Tools Desktop Window Help good plot 0.4 0.3 -02 0.1 2 1.5 0.5 0.5 1.52
Step by Step Solution
There are 3 Steps involved in it

Get step-by-step solutions from verified subject matter experts