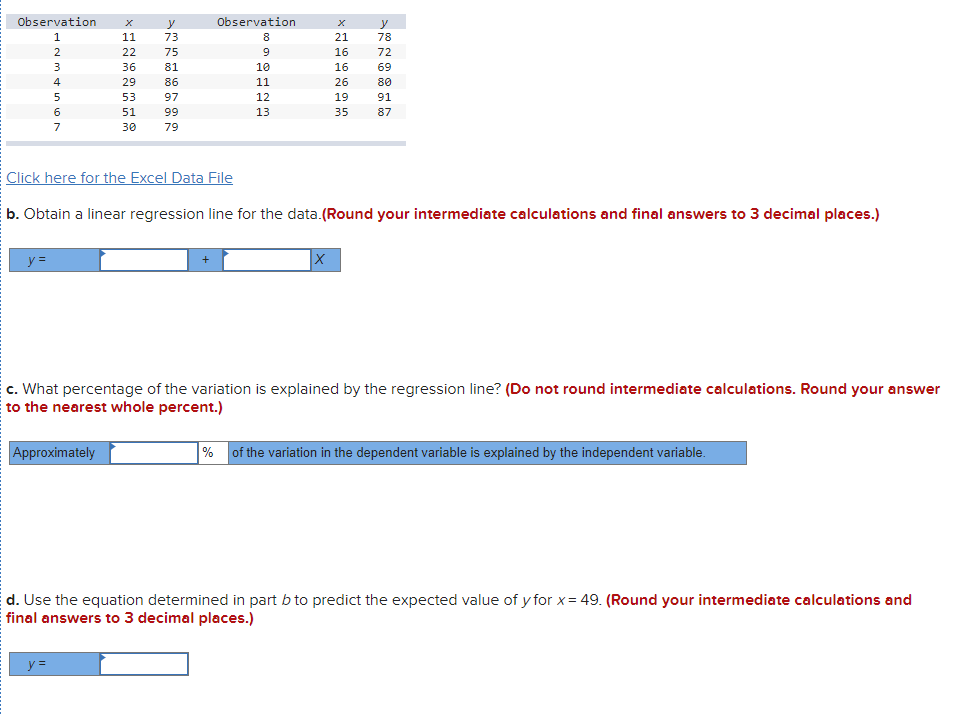
Question: Observation 1 2 3 4 4 5 6 7 11 22 36 29 53 51 30 73 75 81 86 97 99 79 Observation 8

Observation 1 2 3 4 4 5 6 7 11 22 36 29 53 51 30

Observation 1 2 3 4 4 5 6 7 11 22 36 29 53 51 30 73 75 81 86 97 99 79 Observation 8 9 9 10 11 12 13 21 16 16 26 19 35 y 78 72 69 80 91 87 Click here for the Excel Data File b. Obtain a linear regression line for the data.(Round your intermediate calculations and final answers to 3 decimal places.) y = c. What percentage of the variation is explained by the regression line? (Do not round intermediate calculations. Round your answer to the nearest whole percent.) Approximately % of the variation in the dependent variable is explained by the independent variable. d. Use the equation determined in part b to predict the expected value of y for x = 49. (Round your intermediate calculations and final answers to 3 decimal places.) y =

Step by Step Solution

There are 3 Steps involved in it

1 Expert Approved Answer
Step: 1 Unlock blur-text-image
Question Has Been Solved by an Expert!

Get step-by-step solutions from verified subject matter experts

Step: 2 Unlock
Step: 3 Unlock

Students Have Also Explored These Related General Management Questions!