

Question: Observation High Temp (1) Low Temp (v) 75 54 92 74 4 84 57 64 39 64 46 86 68 81 72 61 50 73
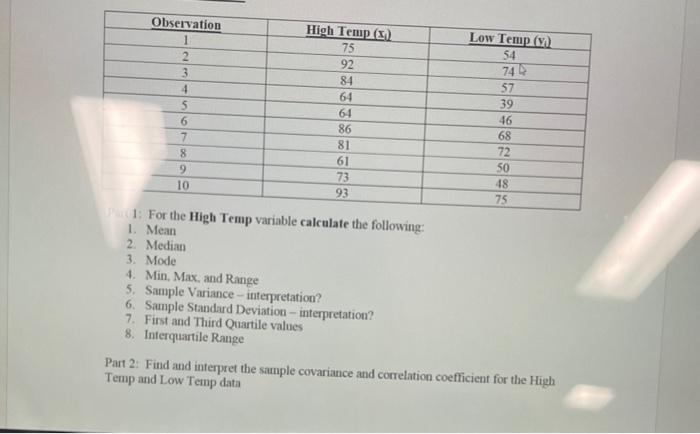

Observation High Temp (1) Low Temp (v) 75 54 92 74 4 84 57 64 39 64 46 86 68 81 72 61 50 73 48 10 93 75 1: For the High Temp variable calculate the following: 1. Mean 2. Median 3. Mode 4. Min, Max. and Range 5, Sample Variance - interpretation? 6. Sample Standard Deviation - interpretation? 7. First and Third Quartile values 8. Interquartile Range Part 2: Find and interpret the sample covariance and correlation coefficient for the High Temp and Low Temp data
Step by Step Solution
There are 3 Steps involved in it
1 Expert Approved Answer
Step: 1 Unlock

Question Has Been Solved by an Expert!
Get step-by-step solutions from verified subject matter experts
Step: 2 Unlock
Step: 3 Unlock