

Question: observations on Y and K were generated by a computer program: Make a E)seatterplot (no need to turn in]. b. Find the equation of the
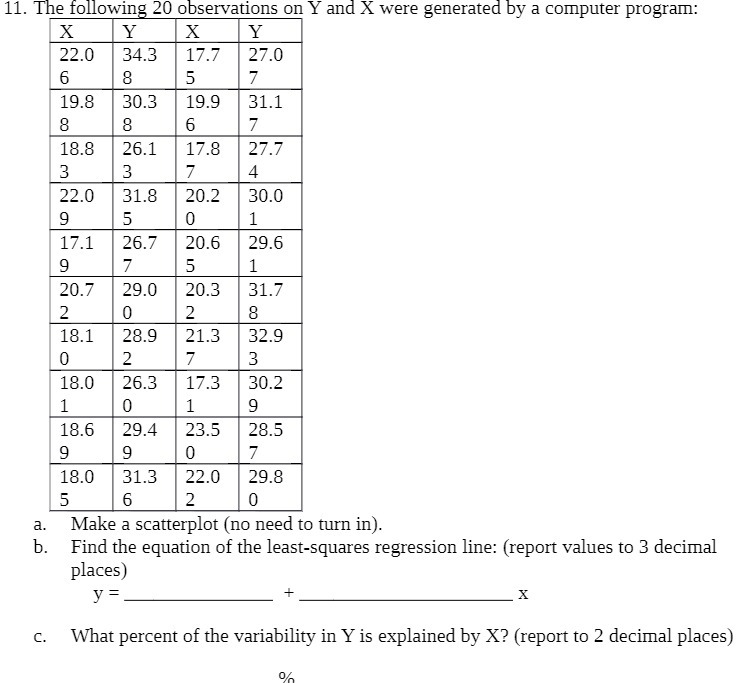
observations on Y and K were generated by a computer program: Make a E)seatterplot (no need to turn in]. b. Find the equation of the least-squares regression line: [report values to 3 decimal Ms K + What percent of the variability in Y is explained by X? [report to 2 decimal places) places} C. \"1
Step by Step Solution
There are 3 Steps involved in it
1 Expert Approved Answer
Step: 1 Unlock

Question Has Been Solved by an Expert!
Get step-by-step solutions from verified subject matter experts
Step: 2 Unlock
Step: 3 Unlock