

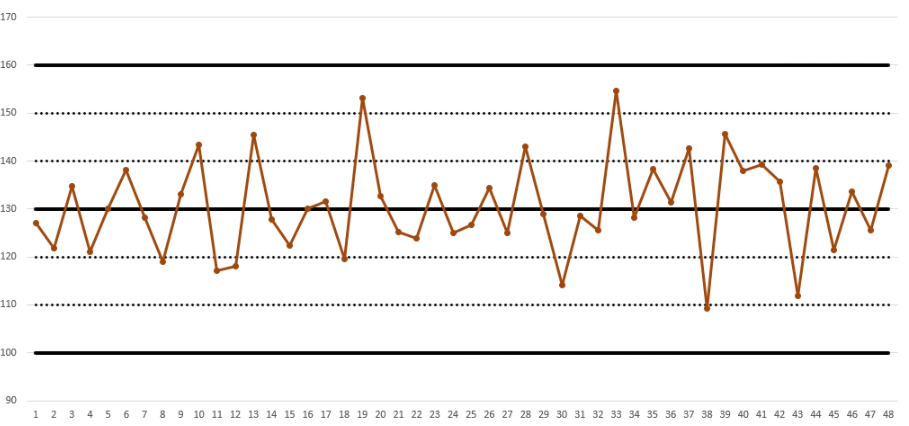
Question: Observe the R chart below. What do you conclude? Choose the correct answers from the drop-down boxes. Is the process in or out of control?
Observe the R chart below. What do you conclude? Choose the correct answers from the drop-down boxes.
Is the process in or out of control?
The out of control condition is? two consecutive points close to the control limits/eight consecutive points near the mean/a trend of eight consecutive points/NA -it is in control/eight consecutive points above or below the mean/a sample outside of control limits?
This indicates the the mean/variance/NA has Increased/decreased/NA.
Step by Step Solution
There are 3 Steps involved in it
1 Expert Approved Answer
Step: 1 Unlock

Question Has Been Solved by an Expert!
Get step-by-step solutions from verified subject matter experts
Step: 2 Unlock
Step: 3 Unlock