

Question: Obviously there are random errors in the mass and length measurements, as well as minor variations across a sheet of paper which will generate uncertainty
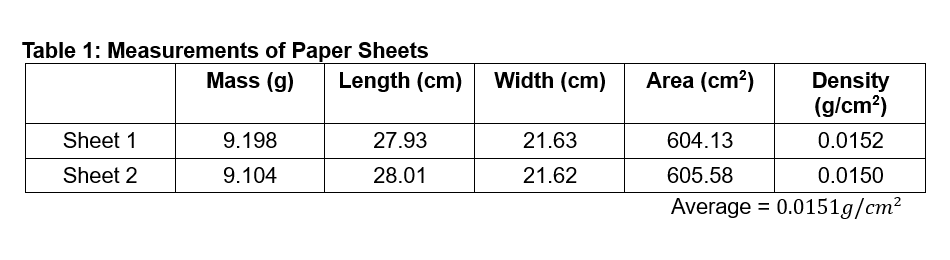
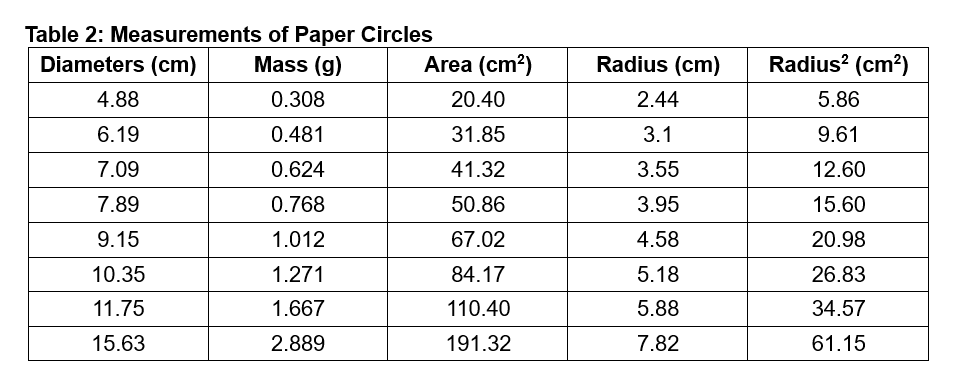
Obviously there are random errors in the mass and length measurements, as well as minor variations across a sheet of paper which will generate uncertainty in our slope. A quick way to estimate this uncertainty is to nd the percent difference between the two density values found in Table 1. Compute this percent difference, and use that percentage to find the uncertainty in the slope value. Summarize the uncertainty range for the slope here. Show all your work. Table 1: Measurements of Paper Sheets Mass (g) Length (cm) Width (cm) Area (cm?) Density (g/cm?) Sheet 1 9. 198 27.93 21.63 604.13 0.0152 Sheet 2 9.104 28.01 21.62 605.58 0.0150 Average = 0.0151g/cmTable 2: Measurements of Paper Circles Diameters (cm) Mass (g) Area (cm?) Radius (cm) Radius2 (cm2) 4.88 0.308 20.40 2.44 5.86 6.19 0.481 31.85 3.1 9.61 7.09 0.624 41.32 3.55 12.60 7.89 0.768 50.86 3.95 15.60 9.15 1.012 67.02 4.58 20.98 10.35 1.271 84.17 5.18 26.83 11.75 1.667 110.40 5.88 34.57 15.63 2.889 191.32 7.82 61.15
Step by Step Solution
There are 3 Steps involved in it

Get step-by-step solutions from verified subject matter experts