

Question: Ocean Carriers uses a 9% discount rate create separate spreadsheets for FCF and NPV on info below It is more efficient to construct the 25-year
Ocean Carriers uses a 9% discount rate
create separate spreadsheets for FCF and NPV on info below
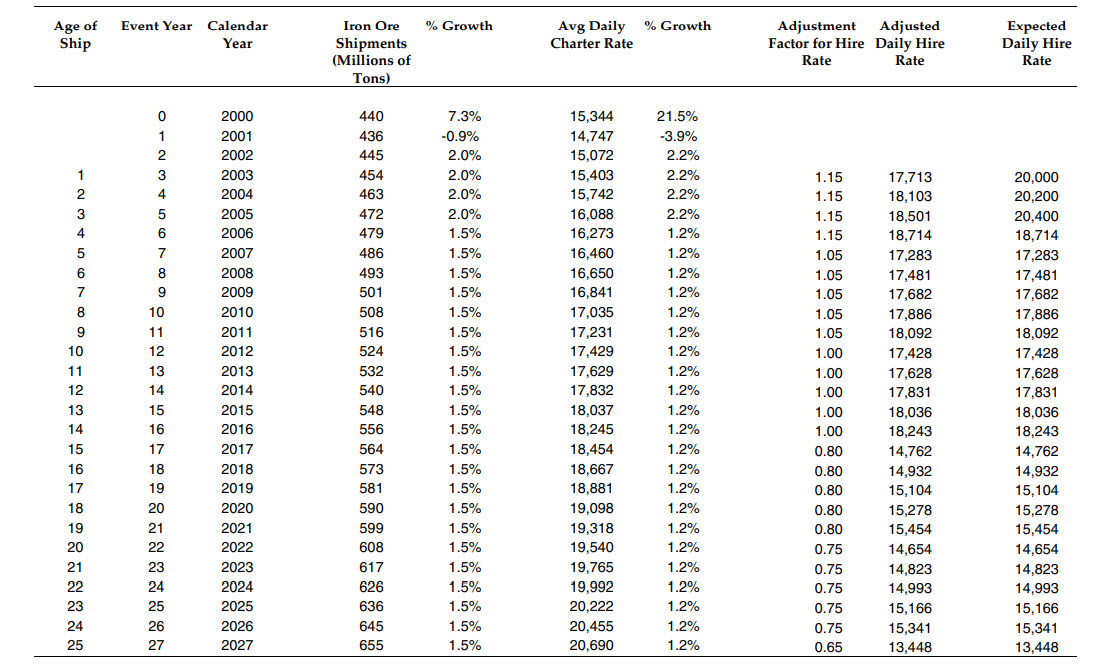
It is more efficient to construct the 25-year taxable scenario first, then revise it to accommodate the other scenarios. Note the pattern of cash flows identified in Exhibit 6. Year 0 is 2000, which is the time of the decision and the period of the first installment on the vessel. The final installment is made at the end of year 2, and immediately afterward (the beginning of year 3) is the first year of the ships operation.
Our convention is to measure the CF from operations (including all revenues and expenses) at the end of the year.
Working capital CF is assumed to occur at the beginning of each period of operations, (i.e. purchase of inventory, stocking of provisions, etc. is needed at the beginning of the period).
Note that only changes in NWC are reflected in CF. In capturing sale of assets, note that only the CFs are included (i.e. proceeds from sale net of tax effect). This is different from after-tax gain or loss. Free Cash Flow (FCF) = Project NI + Depr Exp +/- change in NWC CAPEX +/- After-tax Proceeds from Liquidation of Assets Inflation: Growth is built into project hire rates, but not costs and working capital; discount rate is nominal rate (assume nominal cash flows).
Step by Step Solution
There are 3 Steps involved in it

Get step-by-step solutions from verified subject matter experts