

Question: Old MathJax webview can you please also give me the lower control limits for the 3 sigma R-chart thanks Refer to Table S51 Factor for
Old MathJax webview
can you please also give me the lower control limits for the 3 sigma R-chart thanks
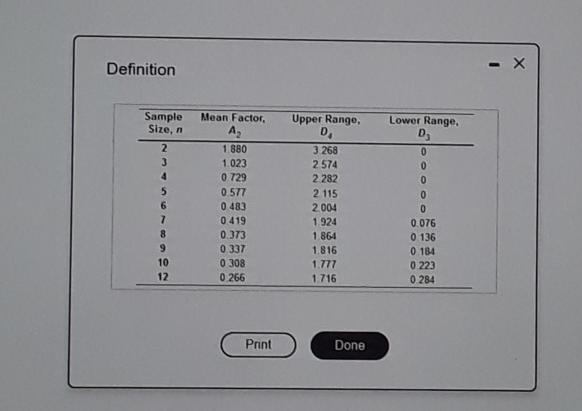
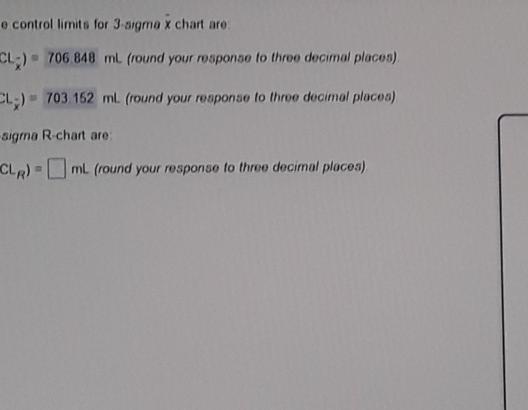
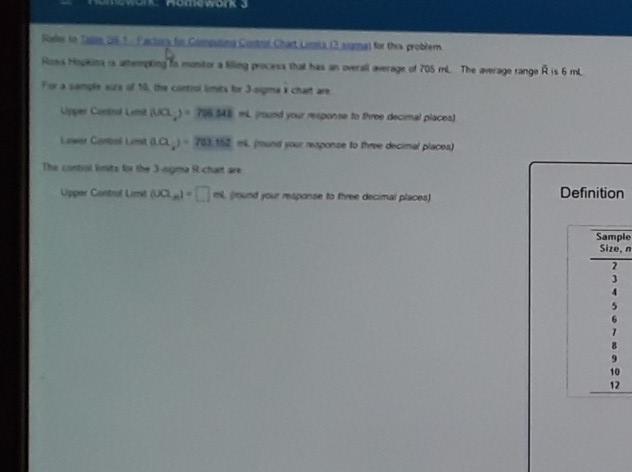
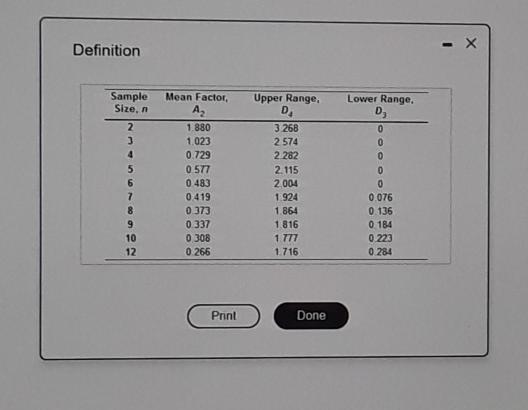
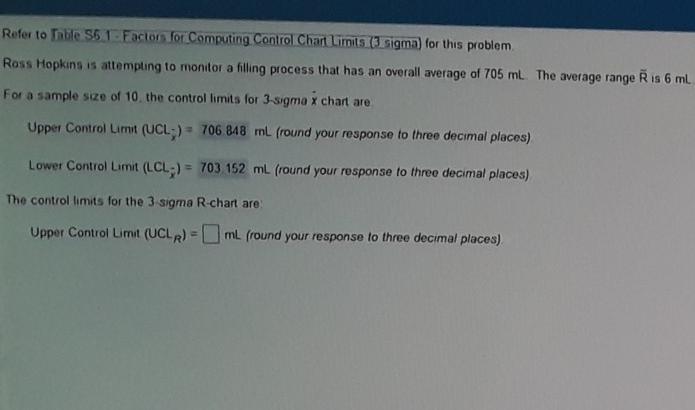
Refer to Table S51 Factor for Computing Control Chart Limits (3 sigma) for this problem Ross Hopkins is attempting to monitor a filling process that has an overall average of 705 mL The average range is 6 ml For a sample size of 10 the controllimits for 3-sigma x chart are Upper Control Limit (UCL) - 706 848 ml (round your response to three decimal places) Lower Control Limit (LCL;) = 703 152 ml (round your response to three decimal places) The control limits for the 3 sigma R-chart are: Upper Control Limit (UCLR) - mL (round your response to three decimal places) Definition Sample Mean Factor Size, 2 3 4 5 6 7 8 9 10 12 1.880 1.023 0 729 0.577 0483 0.419 0.373 0 337 0 308 0 266 Upper Range D 3268 2 574 2 282 2 115 2004 1.924 1 864 1.816 1.777 1.716 Lower Range D 0 0 0 0 0 0.076 0 136 0 134 0.223 0284 Print Done o control limits for 3-sigma x chart are CL) - 706 848 ml (round your response to three decimal places) CL) - 703 162 ml. (round your response to three decimal places) sigmo R chart are CLR) - mL (round your response to three decimal places) the problem tahap 705 m There range Ris 6 m a) Lyou to Doe de placea) one to medendi placea) Cual-dose to three decimal plom) Definition Sample Size, 2 3 4 5 6 7 8 9 10 12 Definition Lower Range. D 0 0 O Sample Size, 2 3 4 5 6 7 8 9 10 12 Mean Factor, A2 1.880 1.023 0.729 0 577 0483 0.419 0.373 0.337 0 308 0.266 Upper Range, D 3268 2 574 2 282 2.115 2004 1924 1.864 1 816 1 777 1716 0 0 0.076 0.136 0 184 0223 0.284 Punt Done
Step by Step Solution
There are 3 Steps involved in it
1 Expert Approved Answer
Step: 1 Unlock

Question Has Been Solved by an Expert!
Get step-by-step solutions from verified subject matter experts
Step: 2 Unlock
Step: 3 Unlock