

Question: Old MathJax webview Financial Risks : Describe the potential impacts of the following types of financial risk on the company featured in the case study:
Old MathJax webview
- Financial Risks: Describe the potential impacts of the following types of financial risk on the company featured in the case study:
- Interest rate risk
- Economic risk
- Credit risk
- Operational risk
- Exhibit 1SciTronics, Inc. Consolidated Income Statements 20052008 ($ in thousands) 2004 2005 2006 2007 2008 Sales $115,000 $147,000 $171,000 $205,000 $244,000 Cost of goods sold 43,000 50,000 63,000 74,000 Gross margin 104,000 121,000 142,000 170,000 Research & development 15,000 20,000 26,000 28,000 Sell, general & administrative 79,000 92,000 106,000 116,000 Operating income 10,000 9,000 10,000 26,000 Interest expense 1,000 2,000 2,000 2,000 Profit before tax 9,000 7,000 8,000 24,000 Income tax 4,000 2,000 3,000 10,000 Net income $ 5,000 $ 5,000 $ 5,000 $ 14,000 Source: Company documents. Exhibit
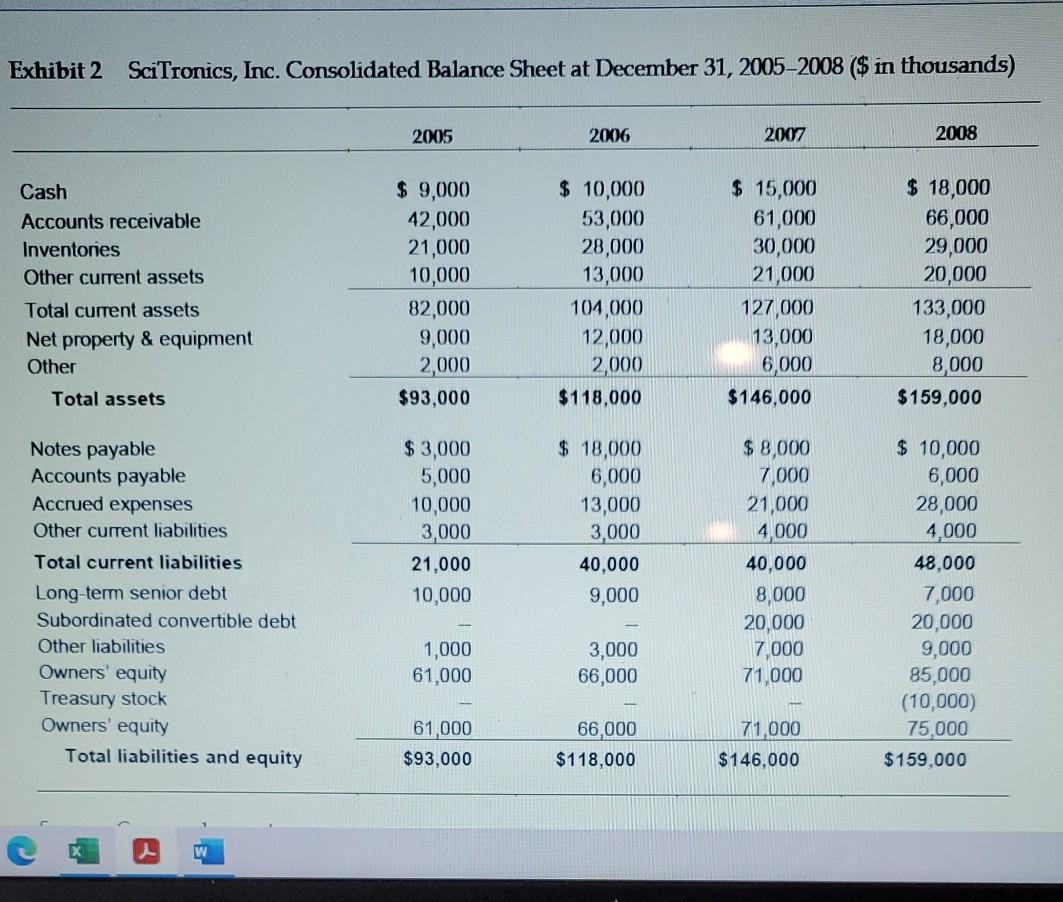
- Exhibit 2SciTronics, Inc. Consolidated Balance Sheet at December 31, 20052008 ($ in thousands) 2005 2006 2007 2008 Cash $ 9,000 $ 10,000 $ 15,000 $ 18,000 Accounts receivable 42,000 53,000 61,000 66,000 Inventories 21,000 28,000 30,000 29,000 Other current assets 10,000 13,000 21,000 20,000 Total current assets 82,000 104,000 127,000 133,000 Net property & equipment 9,000 12,000 13,000 18,000 Other 2,000 2,000 6,000 8,000 Total assets $93,000 $118,000 $146,000 $159,000 Notes payable $ 3,000 $ 18,000 $ 8,000 $ 10,000 Accounts payable 5,000 6,000 7,000 6,000 Accrued expenses 10,000 13,000 21,000 28,000 Other current liabilities 3,000 3,000 4,000 4,000 Total current liabilities 21,000 40,000 40,000 48,000 Long-term senior debt 10,000 9,000 8,000 7,000 Subordinated convertible debt -- -- 20,000 20,000 Other liabilities 1,000 3,000 7,000 9,000 Owners equity 61,000 66,000 71,000 85,000 Treasury stock -- -- -- (10,000) Owners equity 61,000 66,000 71,000 75,000 Total liabilities and equity $93,000 $118,000 $146,000 $159,000 Source: Company
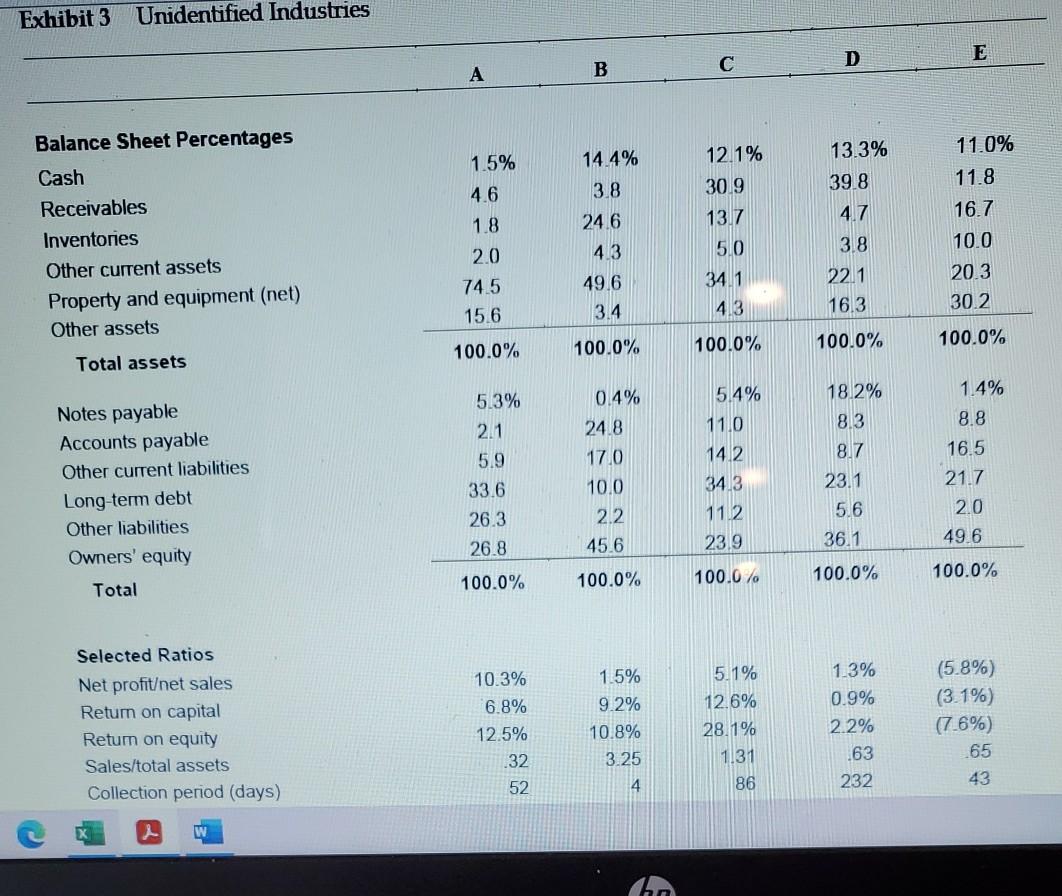
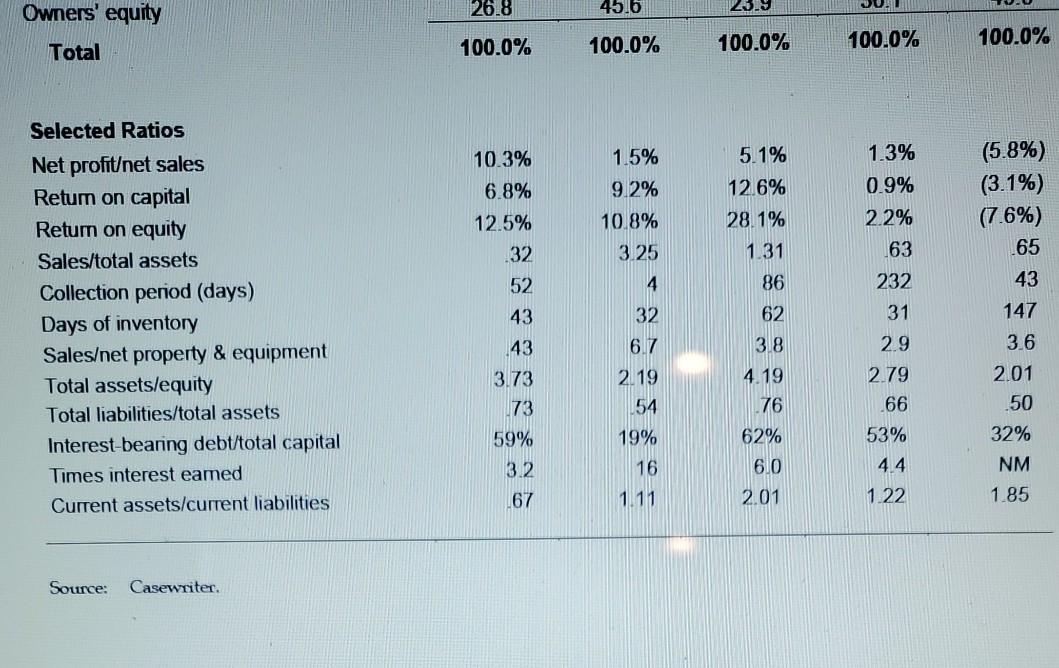
- Exhibit 3Unidentified Industries A B C D E Balance Sheet Percentages Cash 1.5% 14.4% 12.1% 13.3% 11.0% Receivables 4.6 3.8 30.9 39.8 11.8 Inventories 1.8 24.6 13.7 4.7 16.7 Other current assets 2.0 4.3 5.0 3.8 10.0 Property and equipment (net) 74.5 49.6 34.1 22.1 20.3 Other assets 15.6 3.4 4.3 16.3 30.2 Total assets 100.0% 100.0% 100.0% 100.0% 100.0% Notes payable 5.3% 0.4% 5.4% 18.2% 1.4% Accounts payable 2.1 24.8 11.0 8.3 8.8 Other current liabilities 5.9 17.0 14.2 8.7 16.5 Long-term debt 33.6 10.0 34.3 23.1 21.7 Other liabilities 26.3 2.2 11.2 5.6 2.0 Owners equity 26.8 45.6 23.9 36.1 49.6 Total 100.0% 100.0% 100.0% 100.0% 100.0% Selected Ratios Net profitet sales 10.3% 1.5% 5.1% 1.3% (5.8%) Return on capital 6.8% 9.2% 12.6% 0.9% (3.1%) Return on equity 12.5% 10.8% 28.1% 2.2% (7.6%) Sales/total assets .32 3.25 1.31 .63 .65 Collection period (days) 52 4 86 232 43 Days of inventory 43 32 62 31 147 Saleset property & equipment .43 6.7 3.8 2.9 3.6 Total assets/equity 3.73 2.19 4.19 2.79 2.01 Total liabilities/total assets .73 .54 .76 .66 .50 Interest-bearing debt/total capital 59% 19% 62% 53% 32% Times interest earned 3.2 16 6.0 4.4 NM Current assets/current liabilities .67 1.11 2.01 1.22 1.85 Source: Casewriter. This document

911 412 Assessing a Company's Future Finan Exhibit 1 SciTronics, Inc. Consolidated Income Statements 2005-2008 ($ in thousands) 2004 2005 2006 2007 2008 Sales $115,000 Cost of goods sold Gross margin Research & development Sell, general & administrative Operating income Interest expense Profit before tax Income tax Net income $147,000 43,000 104,000 15,000 79,000 10,000 1,000 9,000 4,000 $ 5,000 $171,000 50,000 121,000 20,000 92,000 9,000 2,000 7,000 2,000 $ 5,000 $205,000 63,000 142,000 26,000 106,000 10,000 2,000 8,000 3,000 $ 5,000 $244,000 74,000 170,000 28,000 116,000 26,000 2,000 24,000 10,000 $ 14,000 Source: Company documents. Exhibit 2 SciTronics, Inc. Consolidated Balance Sheet at December 31, 2005-2008 ($ in thousand w Exhibit 2 SciTronics, Inc. Consolidated Balance Sheet at December 31, 2005-2008 ($ in thousands) 2005 2006 2007 2008 Cash Accounts receivable Inventories Other current assets Total current assets Net property & equipment Other $ 9,000 42,000 21,000 10,000 82,000 9,000 2,000 $93,000 $ 10,000 53,000 28,000 13,000 104,000 12,000 2,000 $118,000 $ 15,000 61,000 30,000 21,000 127,000 13,000 6,000 $146,000 $ 18,000 66,000 29,000 20,000 133,000 18,000 8,000 $159,000 Total assets Notes payable Accounts payable Accrued expenses Other current liabilities Total current liabilities Long-term senior debt Subordinated convertible debt Other liabilities Owners' equity Treasury stock Owners' equity Total liabilities and equity $3,000 5,000 10,000 3,000 21,000 10,000 $ 18,000 6,000 13,000 3,000 40,000 9,000 $8,000 7,000 21,000 4,000 40,000 8,000 20,000 7,000 71,000 $ 10,000 6,000 28,000 4,000 48,000 7,000 20,000 9,000 85,000 (10,000) 75,000 $159.000 1,000 61,000 3,000 66,000 61,000 $93,000 66,000 $118,000 71.000 $146,000 Exhibit 3 Unidentified Industries D C B A 1.5% 4.6 13.3% 39.8 4.7 Balance Sheet Percentages Cash Receivables Inventories Other current assets Property and equipment (net) Other assets 1.8 14.4% 3.8 24.6 4.3 49,6 3.4 12.1% 30.9 13.7 50 34.1 413 11.0% 11.8 16.7 10.0 20.3 2.0 74.5 15.6 3.8 22.1 16.3 30.2 100.0% 100.0% 100.0% 100.0% 100.0% Total assets 18.2% 8.3 8.7 Notes payable Accounts payable Other current liabilities Long-term debt Other liabilities Owners' equity Total 5.3% 2.1 5.9 33.6 26.3 26.8 0.4% 24.8 17.0 10.0 22 45.6 5.4% 11.0 14.2 34.3 112 1.4% 8.8 16.5 21.7 2.0 49.6 23.1 5.6 36.1 23.9 100.0 % 100.0% 100.0% 100.0% 100.0% Selected Ratios Net profitet sales Return on capital Retum on equity Sales/total assets Collection period (days) 10.3% 6.8% 12.5% .32 52 1.5% 9.2% 10.8% 3.25 5.1% 12.6% 28.1% 1.31 86 1.3% 0.9% 2.2% 63 232 (5.8%) (3.1%) (7.6%) 65 43 4 W The 26.8 Owners' equity 45.6 UU. 28.9 100.0% 100.0% 100.0% Total 100.0% 100.0% 10.3% 6.8% 12.5% 32 5.1% 12.6% 28.1% 1.31 52 Selected Ratios Net profitet sales Return on capital Return on equity Sales/total assets Collection period (days) Days of inventory Saleset property & equipment Total assets/equity Total liabilities/total assets Interest-bearing debt/total capital Times interest eamed Current assets/current liabilities 1.5% 9.2% 10.8% 3.25 4 32 6.7 2.19 54 19% 1.3% 0.9% 2.2% 63 232 31 2.9 2.79 66 53% 4 4 86 62 3.8 4.19 76 62% 6.0 2.01 43 143 3.73 73 59% 32 67 (5.8%) (3.1%) (7.6%) 165 43 147 3.6 2.01 .50 32% NM 1.85 16 1.11 1.22 Source: Casewriter 911 412 Assessing a Company's Future Finan Exhibit 1 SciTronics, Inc. Consolidated Income Statements 2005-2008 ($ in thousands) 2004 2005 2006 2007 2008 Sales $115,000 Cost of goods sold Gross margin Research & development Sell, general & administrative Operating income Interest expense Profit before tax Income tax Net income $147,000 43,000 104,000 15,000 79,000 10,000 1,000 9,000 4,000 $ 5,000 $171,000 50,000 121,000 20,000 92,000 9,000 2,000 7,000 2,000 $ 5,000 $205,000 63,000 142,000 26,000 106,000 10,000 2,000 8,000 3,000 $ 5,000 $244,000 74,000 170,000 28,000 116,000 26,000 2,000 24,000 10,000 $ 14,000 Source: Company documents. Exhibit 2 SciTronics, Inc. Consolidated Balance Sheet at December 31, 2005-2008 ($ in thousand w Exhibit 2 SciTronics, Inc. Consolidated Balance Sheet at December 31, 2005-2008 ($ in thousands) 2005 2006 2007 2008 Cash Accounts receivable Inventories Other current assets Total current assets Net property & equipment Other $ 9,000 42,000 21,000 10,000 82,000 9,000 2,000 $93,000 $ 10,000 53,000 28,000 13,000 104,000 12,000 2,000 $118,000 $ 15,000 61,000 30,000 21,000 127,000 13,000 6,000 $146,000 $ 18,000 66,000 29,000 20,000 133,000 18,000 8,000 $159,000 Total assets Notes payable Accounts payable Accrued expenses Other current liabilities Total current liabilities Long-term senior debt Subordinated convertible debt Other liabilities Owners' equity Treasury stock Owners' equity Total liabilities and equity $3,000 5,000 10,000 3,000 21,000 10,000 $ 18,000 6,000 13,000 3,000 40,000 9,000 $8,000 7,000 21,000 4,000 40,000 8,000 20,000 7,000 71,000 $ 10,000 6,000 28,000 4,000 48,000 7,000 20,000 9,000 85,000 (10,000) 75,000 $159.000 1,000 61,000 3,000 66,000 61,000 $93,000 66,000 $118,000 71.000 $146,000 Exhibit 3 Unidentified Industries D C B A 1.5% 4.6 13.3% 39.8 4.7 Balance Sheet Percentages Cash Receivables Inventories Other current assets Property and equipment (net) Other assets 1.8 14.4% 3.8 24.6 4.3 49,6 3.4 12.1% 30.9 13.7 50 34.1 413 11.0% 11.8 16.7 10.0 20.3 2.0 74.5 15.6 3.8 22.1 16.3 30.2 100.0% 100.0% 100.0% 100.0% 100.0% Total assets 18.2% 8.3 8.7 Notes payable Accounts payable Other current liabilities Long-term debt Other liabilities Owners' equity Total 5.3% 2.1 5.9 33.6 26.3 26.8 0.4% 24.8 17.0 10.0 22 45.6 5.4% 11.0 14.2 34.3 112 1.4% 8.8 16.5 21.7 2.0 49.6 23.1 5.6 36.1 23.9 100.0 % 100.0% 100.0% 100.0% 100.0% Selected Ratios Net profitet sales Return on capital Retum on equity Sales/total assets Collection period (days) 10.3% 6.8% 12.5% .32 52 1.5% 9.2% 10.8% 3.25 5.1% 12.6% 28.1% 1.31 86 1.3% 0.9% 2.2% 63 232 (5.8%) (3.1%) (7.6%) 65 43 4 W The 26.8 Owners' equity 45.6 UU. 28.9 100.0% 100.0% 100.0% Total 100.0% 100.0% 10.3% 6.8% 12.5% 32 5.1% 12.6% 28.1% 1.31 52 Selected Ratios Net profitet sales Return on capital Return on equity Sales/total assets Collection period (days) Days of inventory Saleset property & equipment Total assets/equity Total liabilities/total assets Interest-bearing debt/total capital Times interest eamed Current assets/current liabilities 1.5% 9.2% 10.8% 3.25 4 32 6.7 2.19 54 19% 1.3% 0.9% 2.2% 63 232 31 2.9 2.79 66 53% 4 4 86 62 3.8 4.19 76 62% 6.0 2.01 43 143 3.73 73 59% 32 67 (5.8%) (3.1%) (7.6%) 165 43 147 3.6 2.01 .50 32% NM 1.85 16 1.11 1.22 Source: Casewriter
Step by Step Solution
There are 3 Steps involved in it

Get step-by-step solutions from verified subject matter experts