

Question: Old MathJax webview Find solutions for your homework business operations management operations management questions and answers for the hmo vaccination program example provided in the
Old MathJax webview
Find solutions for your homework
business
operations management
operations management questions and answers
for the hmo vaccination program example provided in the chapter, reanalyze the situation assuming that the probability of a flu outbreak is 65 percent and the cost of the vaccination program is $8 million. what is your decision under these new condition preview file edit view go tools window help ill be 100% sat 10:09 pm a e healthcare operations management
Question: For The HMO Vaccination Program Example Provided In The Chapter, Reanalyze The Situation Assuming That The Probability Of A Flu Outbreak Is 65 Percent And The Cost Of The Vaccination Program Is $8 Million. What Is Your Decision Under These New Condition Preview File Edit View Go Tools Window Help Ill BE 100% Sat 10:09 PM A E Healthcare Operations Management
This question hasn't been solved yet
Ask an expert
For the HMO vaccination program example provided in the chapter, reanalyze the situation assuming that the probability of a flu outbreak is 65 percent and the cost of the vaccination program is $8 million. What is your decision under these new condition A simple example will help to illustrate this process. A health maintenance organization (HMo) is considering the cconomic benefits of a preventive flu vac- cination program. If the program is not offered, the estimated cost to the HMO if there is a flu outbreak is $8 million with a probability of 0.4 (40 percent), and $12 million with a probability of 0.6 (60 percent). The program is estimated to cost $7 million, and the probability of a flu outbreak occurring is 0.7 (70 per cent). If a flu outbreak does occur and the HMooffers the program afterward, it will still cost the organization $7 million, but the resulting costs to the HMO would be reduccd to $4 million with a probability of 0.4 (40 percent) or $6 mil- lion with a probability of 0.6 (60 percent). What should the HMo decide? The decision tree for the HMO vaccination program is shown in Figure 6.12 FIGURE 6.12 Flu outbreak HMO Vaccination Program Program No flu outbreak Decision Tree l Program HMO vaccination decision Flu outbreak No program No program No flu outbreak H NOTE: The tree diagrams in Figures 6.12 to 6.15 were drawn with the help of PrecisionTree, a software product Now, flu outbreak chance is 65% and cost of vaccination is 8 million. Case1: Cost = 0.65*(8*0.4 + 12*0.6) = 6.76 million Case2: Cost = 8 + 0.65*(4*0.4 + 6*0.6) = 11.38 million How do you find the break even point?
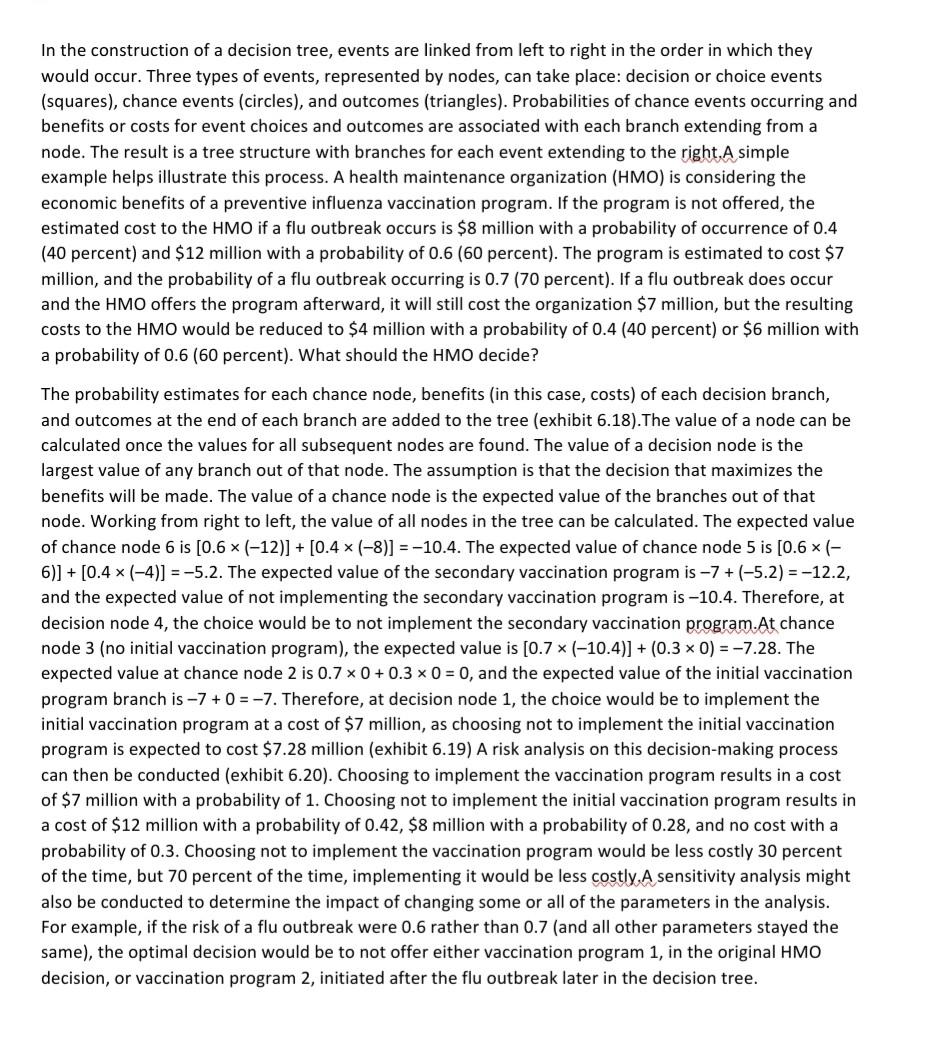
In the construction of a decision tree, events are linked from left to right in the order in which they would occur. Three types of events, represented by nodes, can take place: decision or choice events (squares), chance events (circles), and outcomes (triangles). Probabilities of chance events occurring and benefits or costs for event choices and outcomes are associated with each branch extending from a node. The result is a tree structure with branches for each event extending to the right. A simple example helps illustrate this process. A health maintenance organization (HMO) is considering the economic benefits of a preventive influenza vaccination program. If the program is not offered, the estimated cost to the HMO if a flu outbreak occurs is $8 million with a probability of occurrence of 0.4 (40 percent) and $12 million with a probability of 0.6 (60 percent). The program is estimated to cost $7 million, and the probability of a flu outbreak occurring is 0.7 (70 percent). If a flu outbreak does occur and the HMO offers the program afterward, it will still cost the organization $7 million, but the resulting costs to the HMO would be reduced to $4 million with a probability of 0.4 (40 percent) or $6 million with a probability of 0.6 (60 percent). What should the HMO decide? The probability estimates for each chance node, benefits in this case, costs) of each decision branch, and outcomes at the end of each branch are added to the tree (exhibit 6.18).The value of a node can be calculated once the values for all subsequent nodes are found. The value of a decision node is the largest value of any branch out of that node. The assumption is that the decision that maximizes the benefits will be made. The value of a chance node is the expected value of the branches out of that node. Working from right to left, the value of all nodes in the tree can be calculated. The expected value of chance node 6 is [0.6 (-12)] + [0.4 * (-8)] =-10.4. The expected value of chance node 5 is (0.6 xl- 6)] + [0.4 (-4)] = -5.2. The expected value of the secondary vaccination program is -7 +(-5.2) = -12.2, and the expected value of not implementing the secondary vaccination program is -10.4. Therefore, at decision node 4, the choice would be to not implement the secondary vaccination program.At chance node 3 (no initial vaccination program), the expected value is (0.7 (-10.4)] + (0.3 x 0) = -7.28. The expected value at chance node 2 is 0.7 x 0 + 0.3 x 0 = 0, and the expected value of the initial vaccination program branch is -7 + 0 = -7. Therefore, at decision node 1, the choice would be to implement the initial vaccination program at a cost of $7 million, as choosing not to implement the initial vaccination program is expected to cost $7.28 million (exhibit 6.19) A risk analysis on this decision-making process can then be conducted (exhibit 6.20). Choosing to implement the vaccination program results in a cost of $7 million with a probability of 1. Choosing not to implement the initial vaccination program results in a cost of $12 million with a probability of 0.42, $8 million with a probability of 0.28, and no cost with a probability of 0.3. Choosing not to implement the vaccination program would be less costly 30 percent of the time, but 70 percent of the time, implementing it would be less costly. A sensitivity analysis might also be conducted to determine the impact of changing some or all of the parameters in the analysis. For example, if the risk of a flu outbreak were 0.6 rather than 0.7 (and all other parameters stayed the same), the optimal decision would be to not offer either vaccination program 1, in the original HMO decision, or vaccination program 2, initiated after the flu outbreak later in the decision tree
Step by Step Solution
There are 3 Steps involved in it

Get step-by-step solutions from verified subject matter experts