

Question: Old MathJax webview Hello. This is a Proforma. The blanks in the charts are the items that need to be filled in. Correct and quick
Old MathJax webview
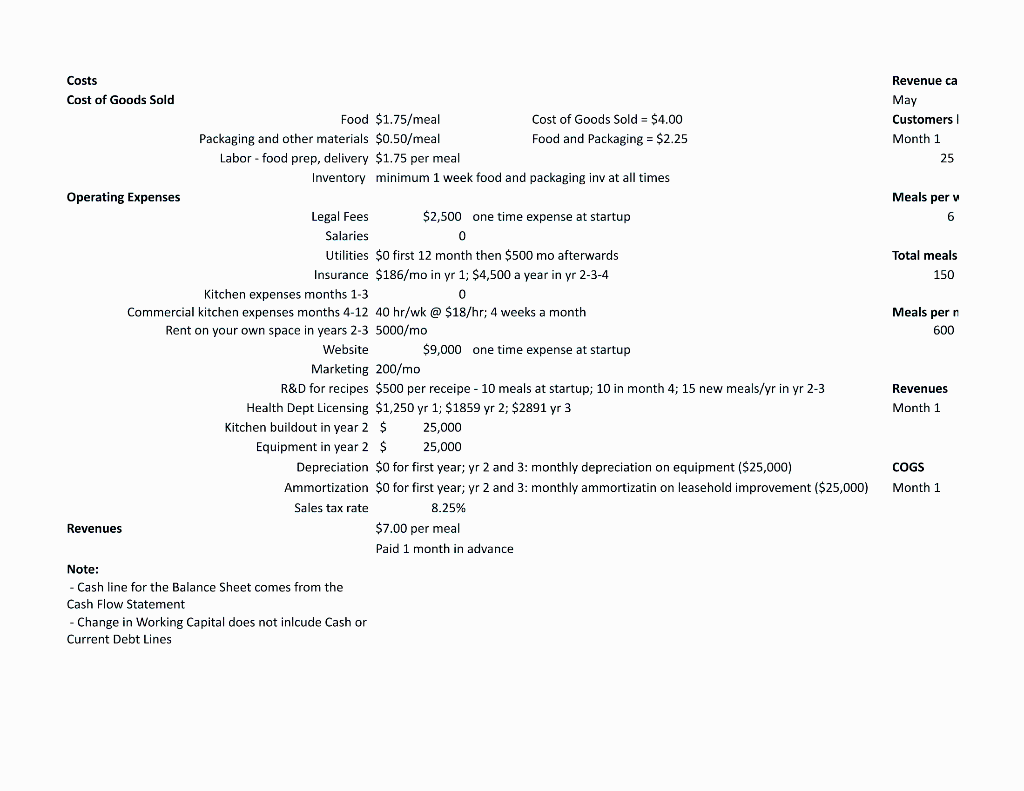
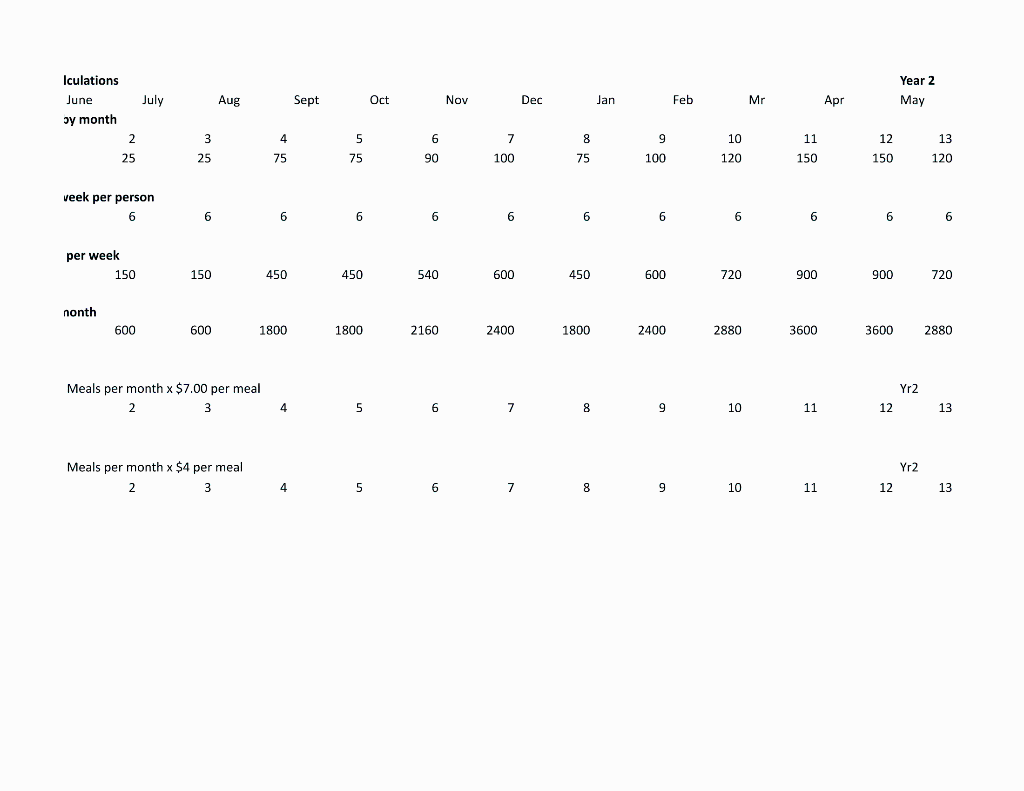
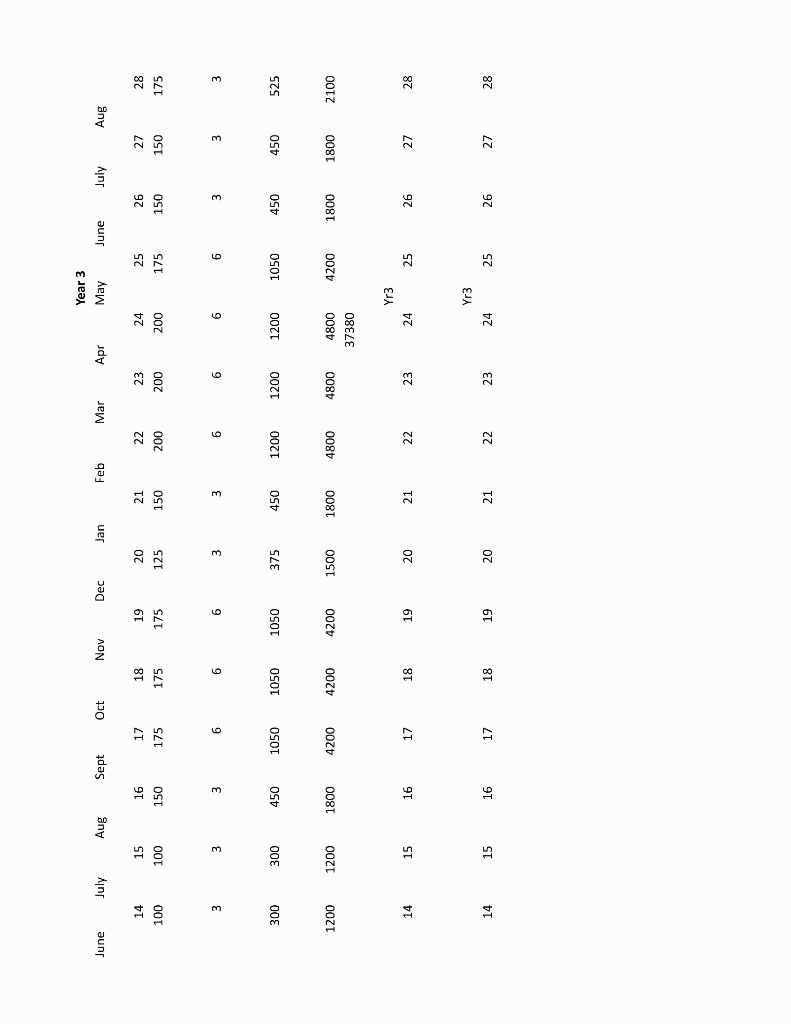
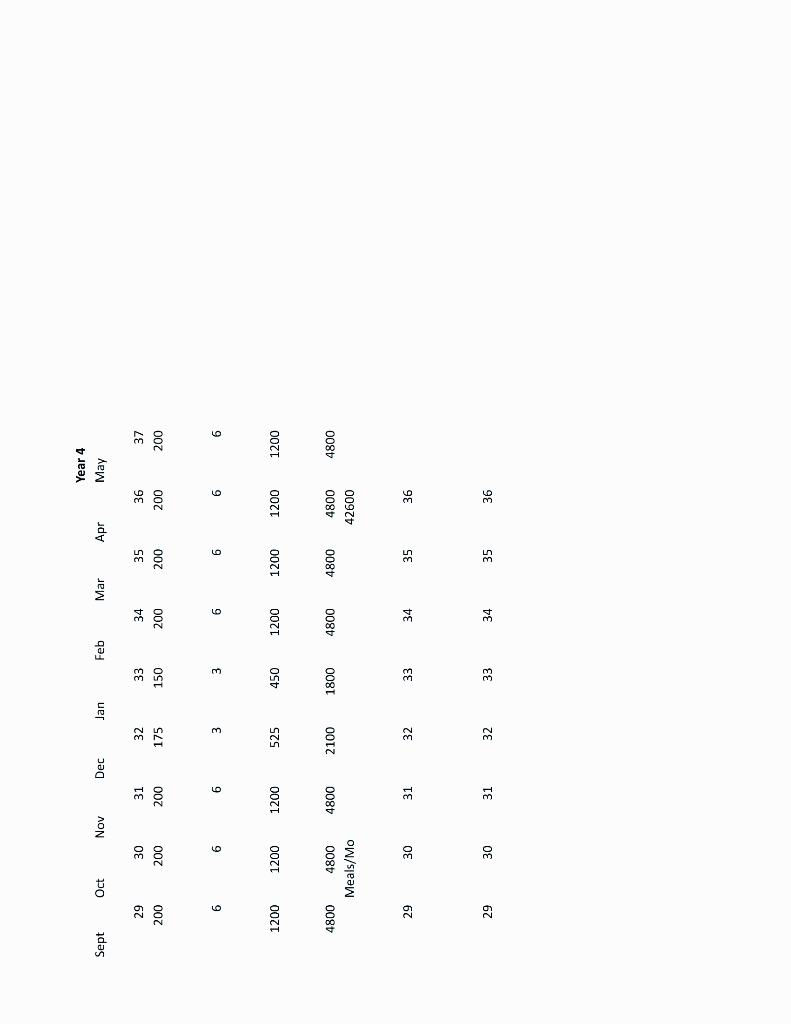
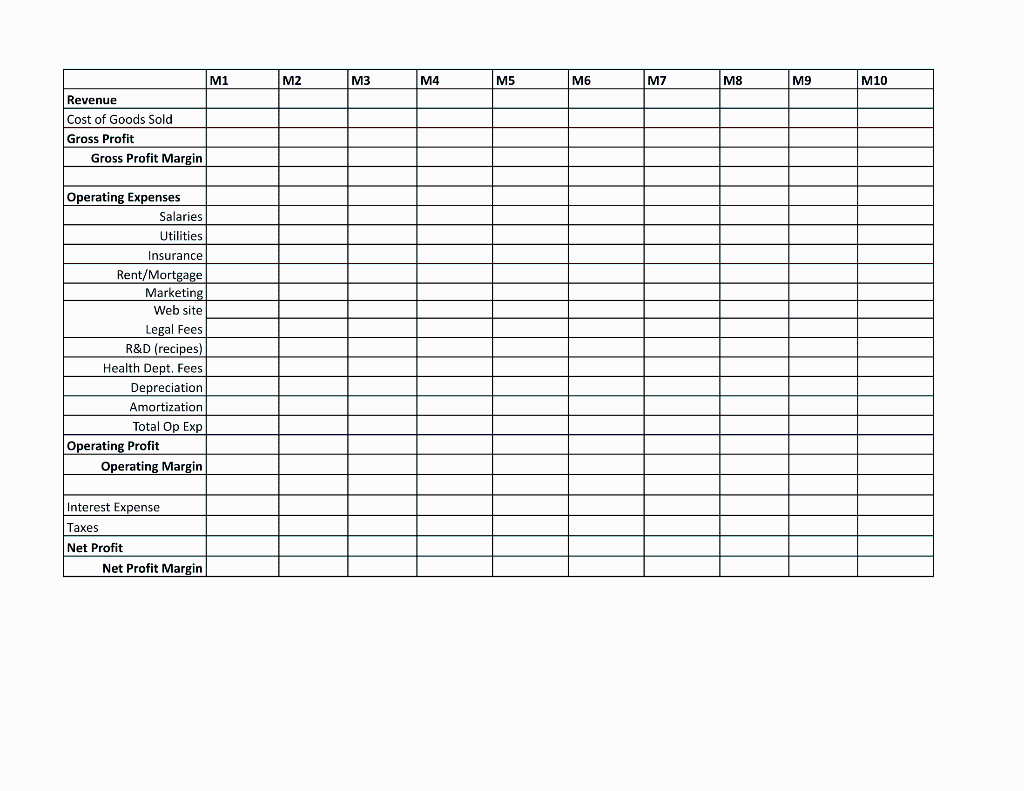
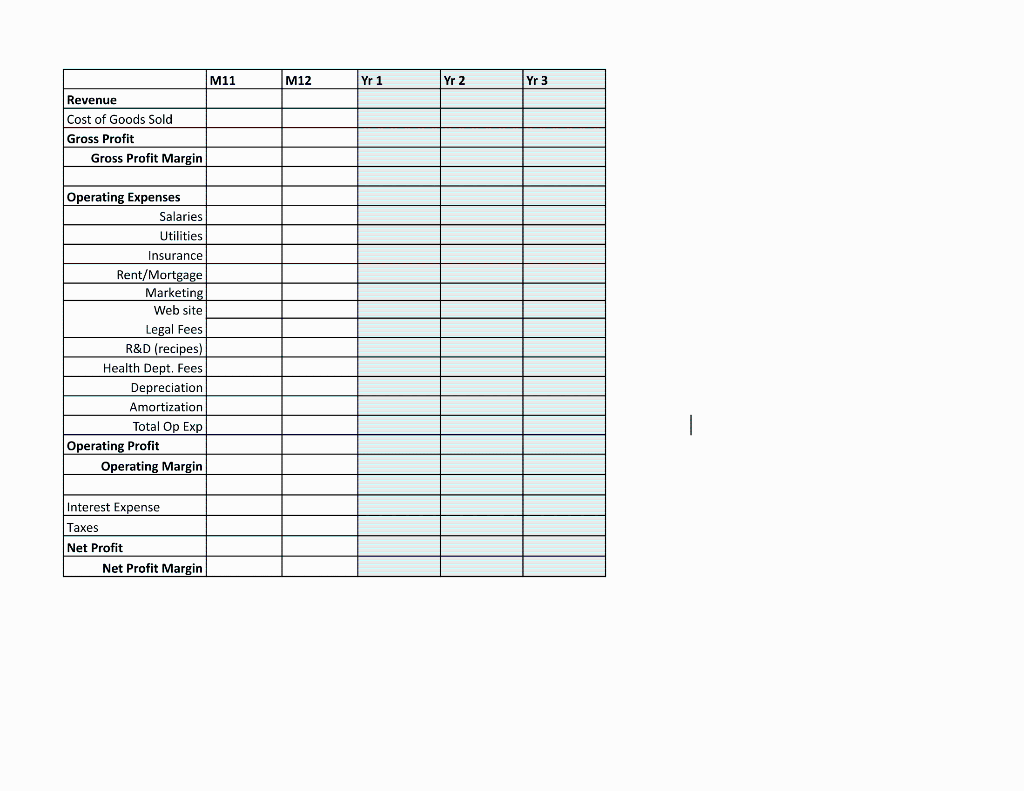
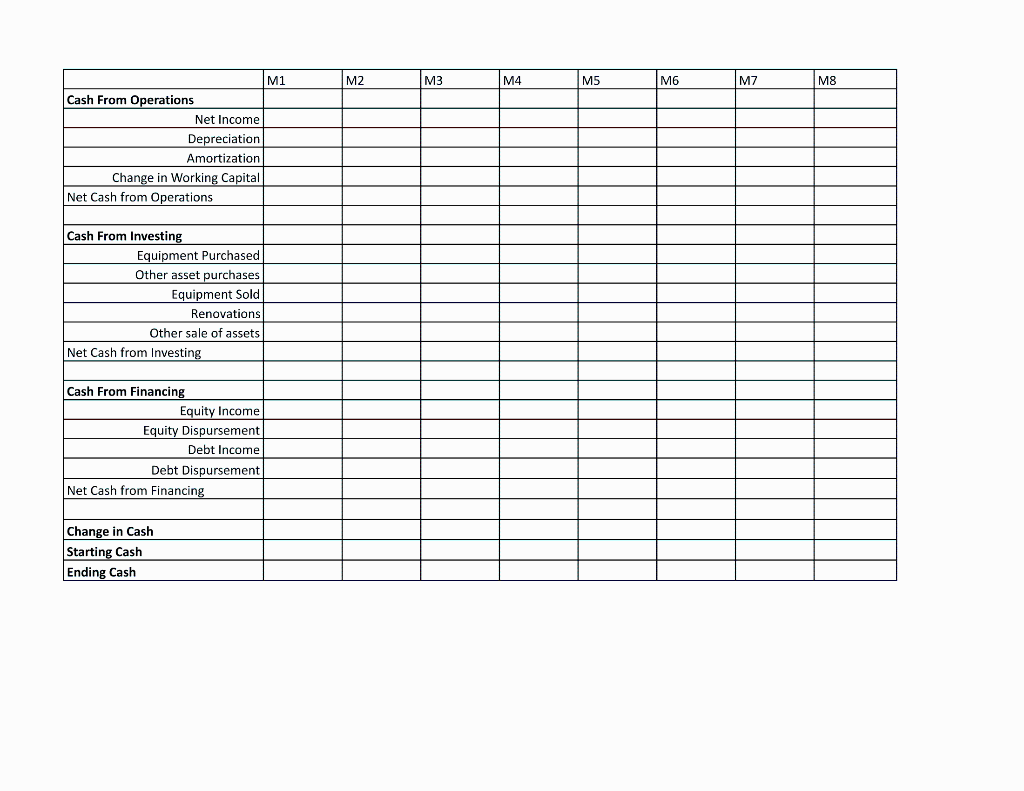
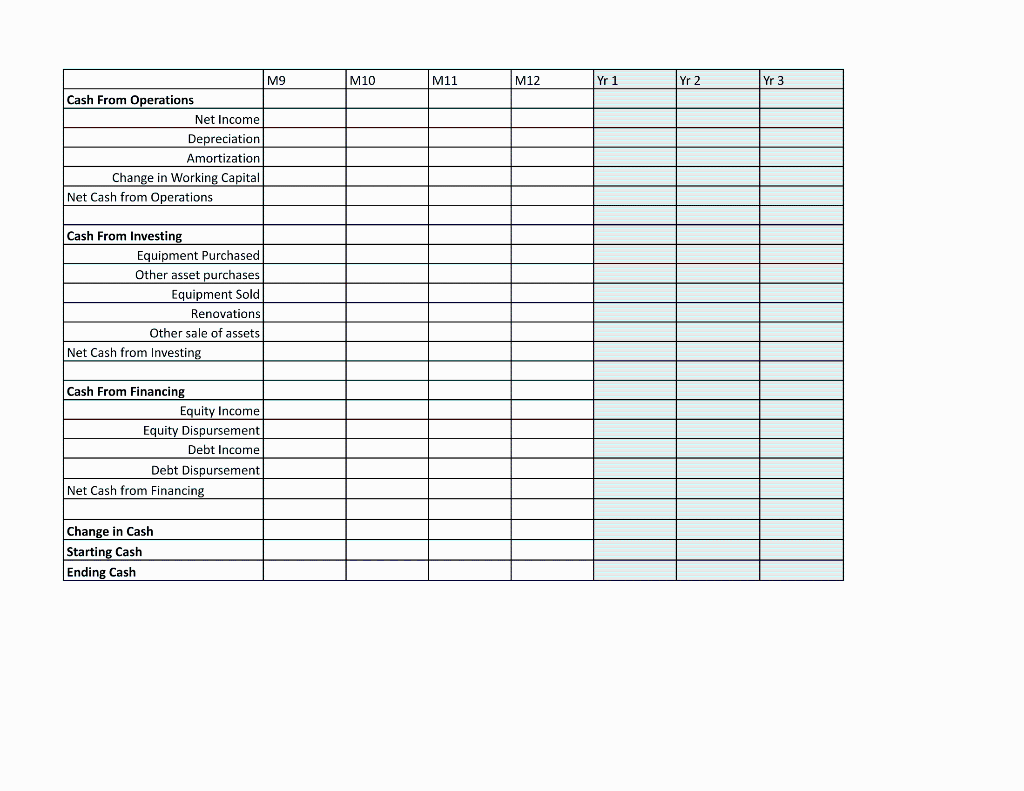
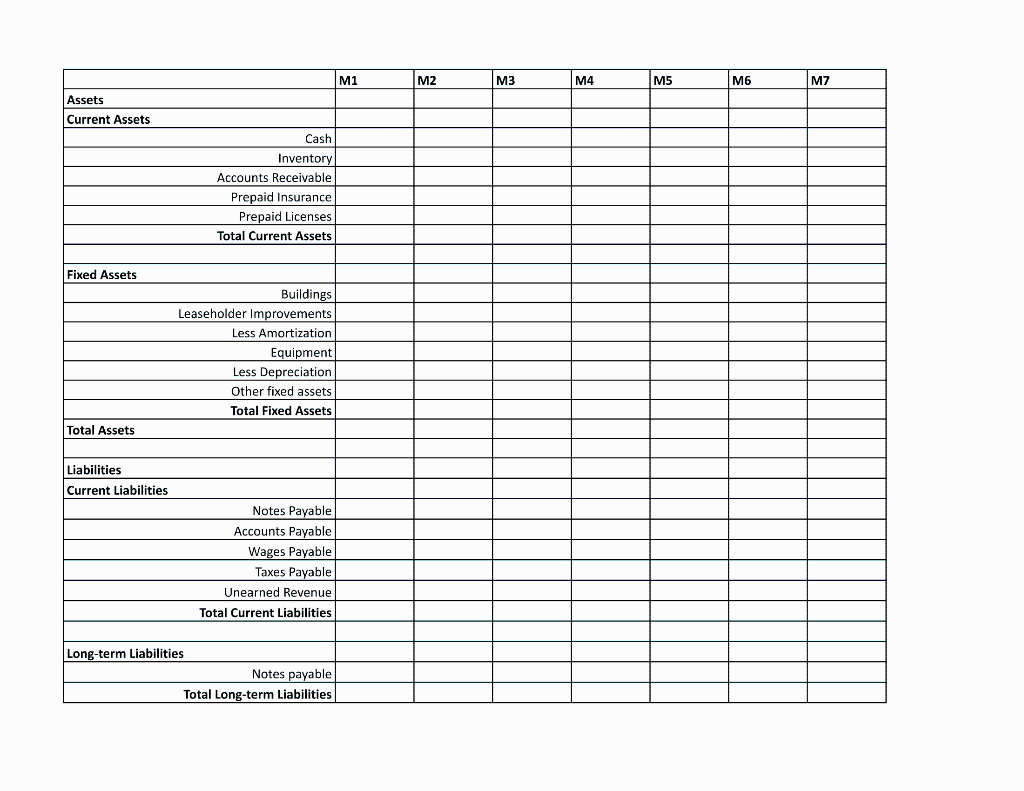
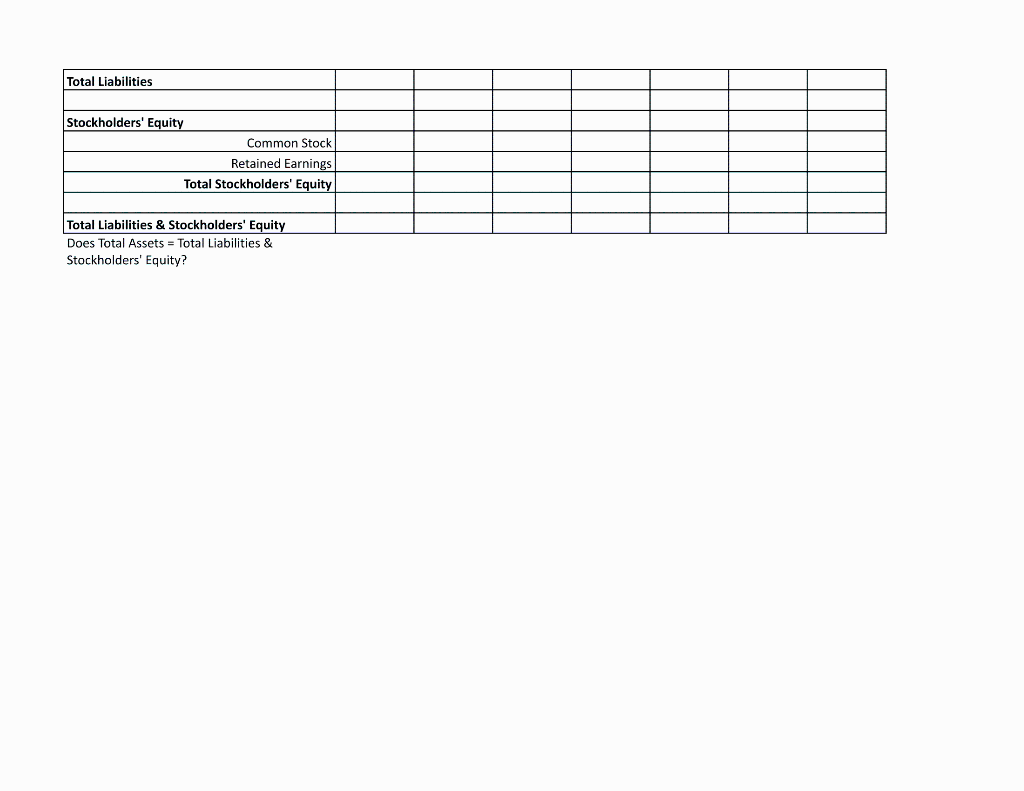
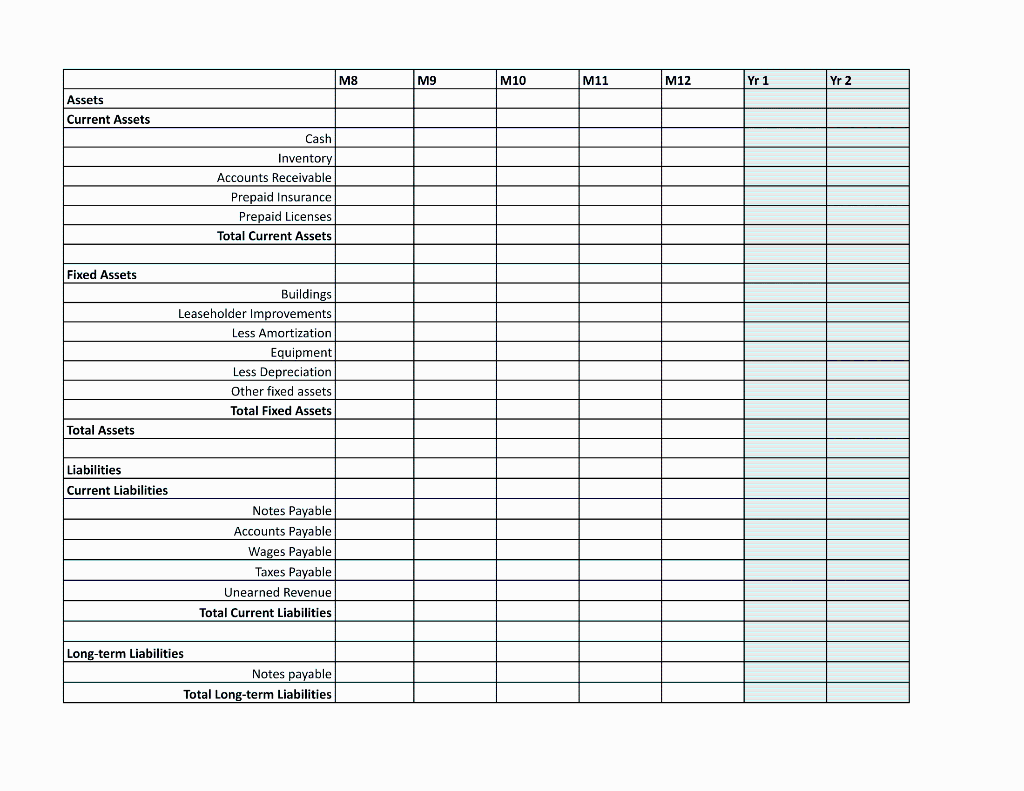
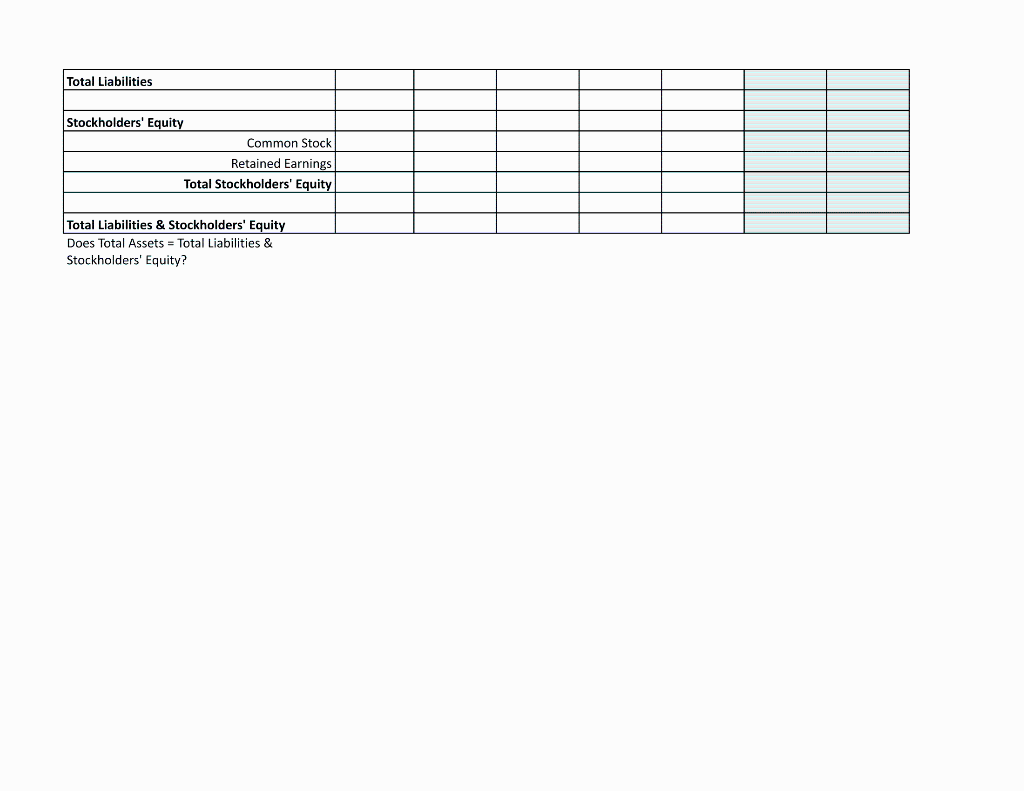

Hello. This is a Proforma. The blanks in the charts are the items that need to be filled in. Correct and quick answers will be given high ratings. Thank you!
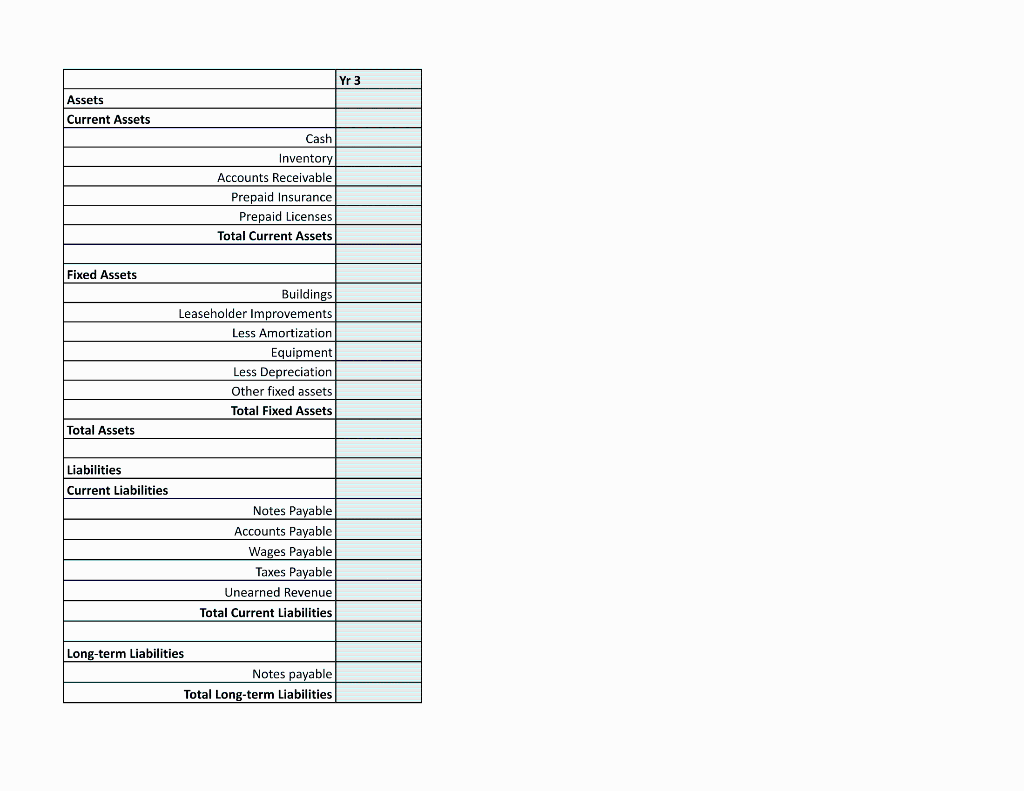
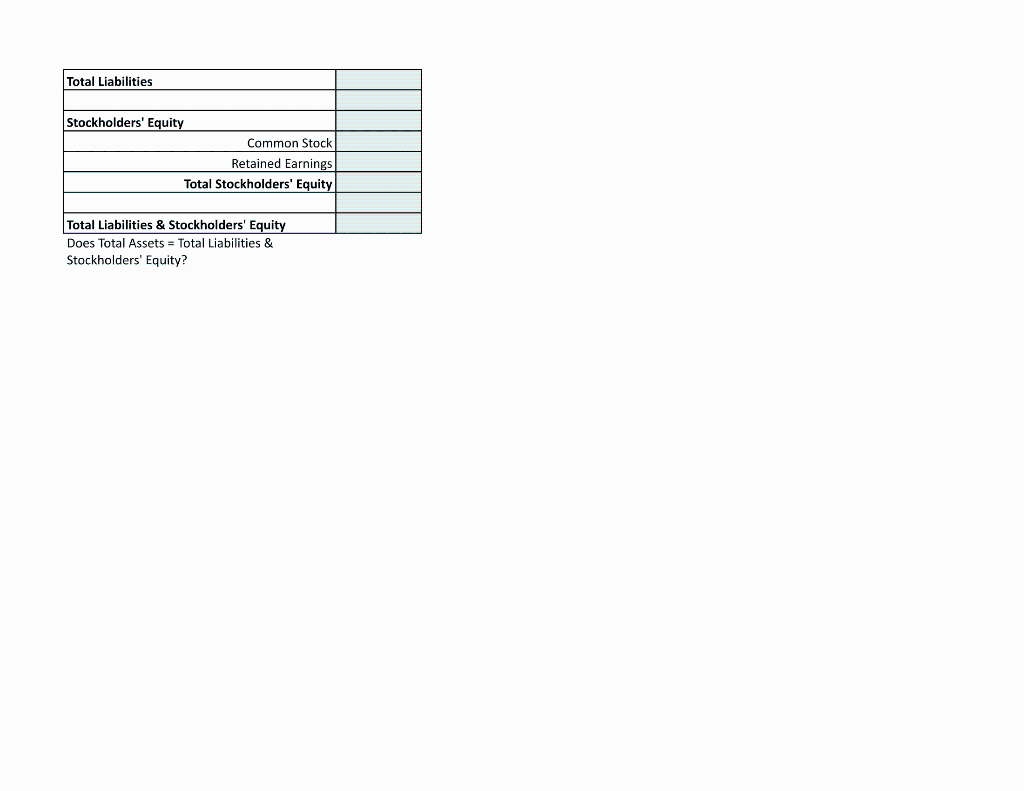
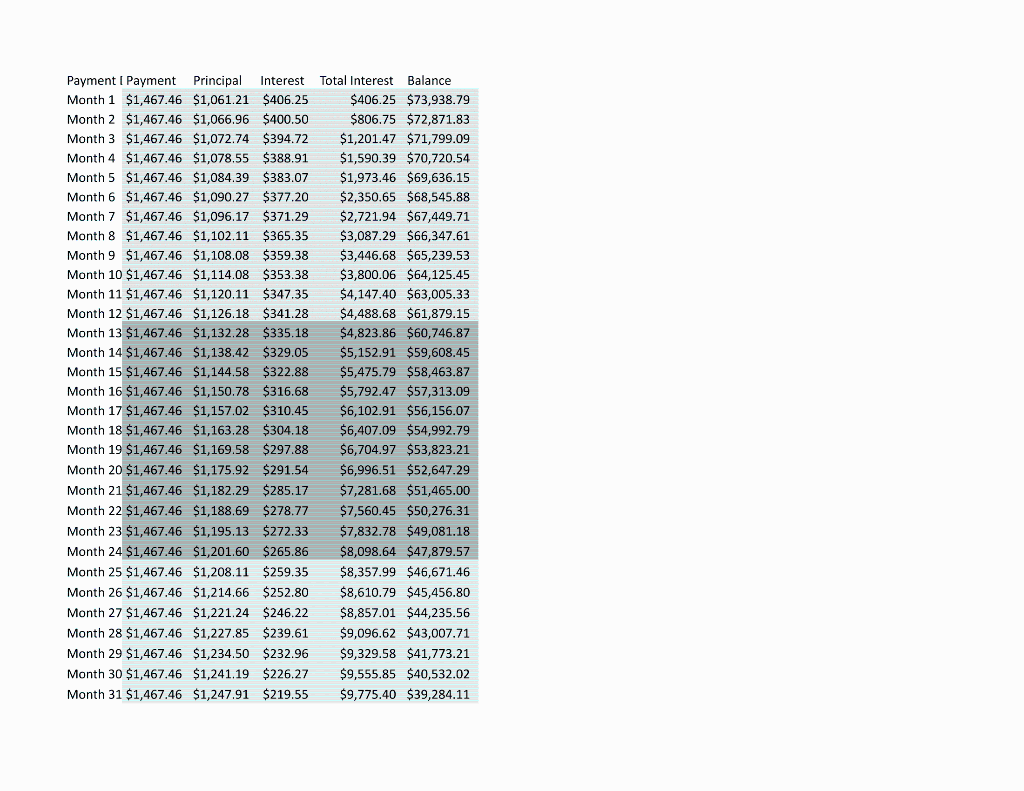
Revenue ca May Customers Month 1 25 Meals per 6 Total meals 150 Meals pern 600 Costs Cost of Goods Sold Food $1.75/meal Cost of Goods Sold = $4.00 Packaging and other materials $0.50/meal Food and Packaging = $2.25 Labor-food prep, delivery $1.75 per meal Inventory minimum 1 week food and packaging inv at all times Operating Expenses Legal Fees $2,500 one time expense at startup Salaries Utilities $0 first 12 month then $500 mo afterwards Insurance $186/mo in yr 1; $4,500 a year in yr 2-3-4 Kitchen expenses months 1-3 0 Commercial kitchen expenses months 4-12 40 hr/wk @ $18/hr; 4 weeks a month Rent on your own space in years 2-3 5000/mo Website $9,000 one time expense at startup Marketing 200/mo R&D for recipes $500 per receipe - 10 meals at startup; 10 in month 4; 15 new meals/yr in yr 2-3 Health Dept Licensing $1,250 yr 1; $1859 yr 2; $2891 yr 3 Kitchen buildout in year 2 $ 25,000 Equipment in year 2 $ 25,000 Depreciation $0 for first year; yr 2 and 3: monthly depreciation on equipment ($25,000) Ammortization $0 for first year; yr 2 and 3: monthly ammortizatin on leasehold improvement ($25,000) Sales tax rate 8.25% Revenues $7.00 per meal Paid 1 month in advance Note: Cash line for the Balance Sheet comes from the Cash Flow Statement Change in Working Capital does not inlcude Cash or Current Debt Lines Revenues Month 1 COGS Month 1 Year 2 May July Aug Sept Oct Noy Dec Jan Feb Mr Apr lculations June by month 2 25 3 4 5 6 8 9 12 13 7 100 10 120 11 150 25 75 75 90 75 100 150 120 veek per person 6 6 6 6 6 6 6 6 6 6 6 6 per week 150 150 450 450 540 600 450 600 720 900 900 720 nonth 600 600 1800 1800 2160 2400 1800 2400 2880 3600 3600 2880 Meals per month x $7.00 per meal 2 3 3 Yr2 12 4 5 6 7 8 9 10 11 13 Yr2 Meals per month x $4 per meal 2 2 3 4 5 6 7 8 9 10 11 12 13 Year 3 May June July Aug Sept Oct Nov Dec Jan Feb Mar Apr June July Aug 17 24 28 14 100 15 100 16 150 18 175 19 175 20 125 21 150 22 200 23 200 25 175 26 150 27 150 175 200 175 3 3 3 3 6 6 6 3 3 6 6 6 6 3 m 3 w 3 300 300 450 1050 1050 1050 375 450 1200 1200 1200 1050 450 450 525 1200 1200 1800 4200 4200 4200 1500 1800 4800 4800 4800 4200 1800 1800 2100 37380 Yr3 14 15 16 17 18 19 20 21 22 23 24 25 26 27 28 Yr3 14 15 16 17 18 19 20 21 22 23 24 25 26 27 28 Sept Year 4 May Oct Nov Dec Jan Feb Mar Apr 30 32 35 29 200 31 200 33 150 34 200 36 200 37 200 200 175 200 6 6 b 3 3 3 6 6 6 6 1200 1200 1200 525 450 1200 1200 1200 1200 4800 4800 2100 1800 4800 4800 4800 4800 Meals/Mo 4800 42600 29 30 31 32 33 34 35 36 29 30 31 32 33 34 35 36 M1 M2 M3 M4 M5 M6 M7 M8 M9 M10 Revenue Cost of Goods Sold Gross Profit Gross Profit Margin Operating Expenses Salaries Utilities Insurance Rent/Mortgage Marketing Web site Legal Fees R&D (recipes) Health Dept. Fees Depreciation Amortization Total Op Exp Operating Profit Operating Margin Interest Expense Taxes Net Profit Net Profit Margin M12 Yr 1 Yr 2 Yr 3 M11 Revenue Cost of Goods Sold Gross Profit Gross Profit Margin Operating Expenses Salaries Utilities Insurance Rent/Mortgage Marketing Web site Legal Fees R&D (recipes) Health Dept. Fees Depreciation Amortization Total Op Exp Operating Profit Operating Margin Interest Expense Taxes Net Profit Net Profit Margin M2 M3 M4 M5 M6 M7 M8 M1 Cash From Operations Net Income Depreciation Amortization Change in Working Capital Net Cash from Operations Cash From Investing Equipment Purchased Other asset purchases Equipment Sold Renovations Other sale of assets Net Cash from Investing Cash From Financing Equity Income Equity Dispursement Debt Income Debt Dispursement Net Cash from Financing Change in Cash Starting Cash Ending Cash M10 M11 M12 Yr 1 Yr 2 Yr 3 M9 Cash From Operations Net Income Depreciation Amortization Change in Working Capital Net Cash from Operations Cash From Investing Equipment Purchased Other asset purchases Equipment Sold Renovations Other sale of assets Net Cash from Investing Cash From Financing Equity Income Equity Dispursement Debt Income Debt Dispursement Net Cash from Financing Change in Cash Starting Cash Ending Cash M1 M2 M3 M4 M5 M6 M7 Assets Current Assets Cash Inventory Accounts Receivable Prepaid Insurance Prepaid Licenses Total Current Assets Fixed Assets Buildings Leaseholder Improvements Less Amortization Equipment Less Depreciation Other fixed assets Total Fixed Assets Total Assets Liabilities Current Liabilities Notes Payable Accounts Payable Wages Payable Taxes Payable Unearned Revenue Total Current Liabilities Long-term Liabilities Notes payable Total Long-term Liabilities Total Liabilities Stockholders' Equity Common Stock Retained Earnings Total Stockholders' Equity Total Liabilities & Stockholders' Equity Does Total Assets = Total Liabilities & Stockholders' Equity? M8 M9 M10 M11 M12 Yr 1 Yr 2 Assets Current Assets Cash Inventory Accounts Receivable Prepaid Insurance Prepaid Licenses Total Current Assets Fixed Assets Buildings Leaseholder Improvements Less Amortization Equipment Less Depreciation Other fixed assets Total Fixed Assets Total Assets Liabilities Current Liabilities Notes Payable Accounts Payable Wages Payable Taxes Payable Unearned Revenue Total Current Liabilities Long-term Liabilities Notes payable Total Long-term Liabilities Total Liabilities Stockholders' Equity Common Stock Retained Earnings Total Stockholders' Equity Total Liabilities & Stockholders' Equity Does Total Assets = Total Liabilities & Stockholders' Equity? Yr 3 Assets Current Assets Cash Inventory Accounts Receivable Prepaid Insurance Prepaid Licenses Total Current Assets Fixed Assets Buildings Leaseholder Improvements Less Amortization Equipment Less Depreciation Other fixed assets Total Fixed Assets Total Assets Liabilities Current Liabilities Notes Payable Accounts Payable Wages Payable Taxes Payable Unearned Revenue Total Current Liabilities Long-term Liabilities Notes payable Total Long-term Liabilities Total Liabilities Stockholders' Equity Common Stock Retained Earnings Total Stockholders' Equity Total Liabilities & Stockholders' Equity Does Total Assets = Total Liabilities & Stockholders' Equity? Payment I Payment Principal Interest Total Interest Balance Month 1 $1,467.46 $1,061.21 $406.25 $406.25 $73,938.79 Month 2 $1,467.46 $1,066.96 $400.50 $806.75 $72,871.83 Month 3 $1,467.46 $1,072.74 $394.72 $1,201.47 $71,799.09 Month 4 $1,467.46 $1,078.55 $388.91 $1,590.39 $70,720.54 Month 5 $1,467.46 $1,084.39 $383.07 $1,973.46 $69,636.15 Month 6 $1,467.46 $1,090.27 $377.20 $2,350.65 $68,545.88 Month 7 $1,467.46 $1,096.17 $371.29 $2,721.94 $67,449.71 Month 8 $1,467.46 $1,102.11 $365.35 $3,087.29 $66,347.61 Month 9 $1,467.46 $1,108.08 $359.38 $3,446.68 $65,239.53 Month 10 $1,467.46 $1,114.08 $353.38 $3,800.06 $64,125.45 Month 11 $1,467.46 $1,120.11 $347.35 $4,147.40 $63,005.33 Month 12 $1,467.46 $1,126.18 $341.28 $4,488.68 $61,879.15 Month 13 $1,467.46 $1,132.28 $335.18 $4,823.86 $60,746.87 Month 14 $1,467.46 $1,138.42 $329.05 $5,152.91 $59,608.45 Month 15 $1,467.46 $1,144.58 $322.88 $5,475.79 $58,463.87 Month 16 $1,467.46 $1,150.78 $316.68 $5,792.47 $57,313.09 Month 17 $1,467.46 $1,157.02 $310.45 $6,102.91 $56,156.07 Month 18 $1,467.46 $1,163.28 $304.18 $6,407.09 $54,992.79 Month 19 $1,467.46 $1,169.58 $297.88 $6,704.97 $53,823.21 Month 20 $1,467.46 $1,175.92 $291.54 $6,996.51 $52,647.29 Month 21 $1,467.46 $1,182.29 $285.17 $7,281.68 $51,465.00 Month 22 $1,467.46 $1,188.69 $278.77 $7,560.45 $50,276.31 Month 23 $1,467.46 $1,195.13 $272.33 $7,832.78 $49,081.18 Month 24 $1,467.46 $1,201.60 $265.86 $8,098.64 $47,879.57 Month 25 $1,467.46 $1,208.11 $259.35 $8,357.99 $46,671.46 Month 26 $1,467.46 $1,214.66 $252.80 $8,610.79 $45,456.80 Month 27 $1,467.46 $1,221.24 $246.22 $8,857.01 $44,235.56 Month 28 $1,467.46 $1,227.85 $239.61 $9,096.62 $43,007.71 Month 29 $1,467.46 $1,234.50 $232.96 $9,329.58 $41,773.21 Month 30 $1,467.46 $1,241.19 $226.27 $9,555.85 $40,532.02 Month 31 $1,467.46 $1,247.91 $219.55 $9,775.40 $39,284.11 M10 M11 M12 Yr 1 Yr 2 Yr 3 M9 Cash From Operations Net Income Depreciation Amortization Change in Working Capital Net Cash from Operations Cash From Investing Equipment Purchased Other asset purchases Equipment Sold Renovations Other sale of assets Net Cash from Investing Cash From Financing Equity Income Equity Dispursement Debt Income Debt Dispursement Net Cash from Financing Change in Cash Starting Cash Ending Cash Revenue ca May Customers Month 1 25 Meals per 6 Total meals 150 Meals pern 600 Costs Cost of Goods Sold Food $1.75/meal Cost of Goods Sold = $4.00 Packaging and other materials $0.50/meal Food and Packaging = $2.25 Labor-food prep, delivery $1.75 per meal Inventory minimum 1 week food and packaging inv at all times Operating Expenses Legal Fees $2,500 one time expense at startup Salaries Utilities $0 first 12 month then $500 mo afterwards Insurance $186/mo in yr 1; $4,500 a year in yr 2-3-4 Kitchen expenses months 1-3 0 Commercial kitchen expenses months 4-12 40 hr/wk @ $18/hr; 4 weeks a month Rent on your own space in years 2-3 5000/mo Website $9,000 one time expense at startup Marketing 200/mo R&D for recipes $500 per receipe - 10 meals at startup; 10 in month 4; 15 new meals/yr in yr 2-3 Health Dept Licensing $1,250 yr 1; $1859 yr 2; $2891 yr 3 Kitchen buildout in year 2 $ 25,000 Equipment in year 2 $ 25,000 Depreciation $0 for first year; yr 2 and 3: monthly depreciation on equipment ($25,000) Ammortization $0 for first year; yr 2 and 3: monthly ammortizatin on leasehold improvement ($25,000) Sales tax rate 8.25% Revenues $7.00 per meal Paid 1 month in advance Note: Cash line for the Balance Sheet comes from the Cash Flow Statement Change in Working Capital does not inlcude Cash or Current Debt Lines Revenues Month 1 COGS Month 1 Year 2 May July Aug Sept Oct Noy Dec Jan Feb Mr Apr lculations June by month 2 25 3 4 5 6 8 9 12 13 7 100 10 120 11 150 25 75 75 90 75 100 150 120 veek per person 6 6 6 6 6 6 6 6 6 6 6 6 per week 150 150 450 450 540 600 450 600 720 900 900 720 nonth 600 600 1800 1800 2160 2400 1800 2400 2880 3600 3600 2880 Meals per month x $7.00 per meal 2 3 3 Yr2 12 4 5 6 7 8 9 10 11 13 Yr2 Meals per month x $4 per meal 2 2 3 4 5 6 7 8 9 10 11 12 13 Year 3 May June July Aug Sept Oct Nov Dec Jan Feb Mar Apr June July Aug 17 24 28 14 100 15 100 16 150 18 175 19 175 20 125 21 150 22 200 23 200 25 175 26 150 27 150 175 200 175 3 3 3 3 6 6 6 3 3 6 6 6 6 3 m 3 w 3 300 300 450 1050 1050 1050 375 450 1200 1200 1200 1050 450 450 525 1200 1200 1800 4200 4200 4200 1500 1800 4800 4800 4800 4200 1800 1800 2100 37380 Yr3 14 15 16 17 18 19 20 21 22 23 24 25 26 27 28 Yr3 14 15 16 17 18 19 20 21 22 23 24 25 26 27 28 Sept Year 4 May Oct Nov Dec Jan Feb Mar Apr 30 32 35 29 200 31 200 33 150 34 200 36 200 37 200 200 175 200 6 6 b 3 3 3 6 6 6 6 1200 1200 1200 525 450 1200 1200 1200 1200 4800 4800 2100 1800 4800 4800 4800 4800 Meals/Mo 4800 42600 29 30 31 32 33 34 35 36 29 30 31 32 33 34 35 36 M1 M2 M3 M4 M5 M6 M7 M8 M9 M10 Revenue Cost of Goods Sold Gross Profit Gross Profit Margin Operating Expenses Salaries Utilities Insurance Rent/Mortgage Marketing Web site Legal Fees R&D (recipes) Health Dept. Fees Depreciation Amortization Total Op Exp Operating Profit Operating Margin Interest Expense Taxes Net Profit Net Profit Margin M12 Yr 1 Yr 2 Yr 3 M11 Revenue Cost of Goods Sold Gross Profit Gross Profit Margin Operating Expenses Salaries Utilities Insurance Rent/Mortgage Marketing Web site Legal Fees R&D (recipes) Health Dept. Fees Depreciation Amortization Total Op Exp Operating Profit Operating Margin Interest Expense Taxes Net Profit Net Profit Margin M2 M3 M4 M5 M6 M7 M8 M1 Cash From Operations Net Income Depreciation Amortization Change in Working Capital Net Cash from Operations Cash From Investing Equipment Purchased Other asset purchases Equipment Sold Renovations Other sale of assets Net Cash from Investing Cash From Financing Equity Income Equity Dispursement Debt Income Debt Dispursement Net Cash from Financing Change in Cash Starting Cash Ending Cash M10 M11 M12 Yr 1 Yr 2 Yr 3 M9 Cash From Operations Net Income Depreciation Amortization Change in Working Capital Net Cash from Operations Cash From Investing Equipment Purchased Other asset purchases Equipment Sold Renovations Other sale of assets Net Cash from Investing Cash From Financing Equity Income Equity Dispursement Debt Income Debt Dispursement Net Cash from Financing Change in Cash Starting Cash Ending Cash M1 M2 M3 M4 M5 M6 M7 Assets Current Assets Cash Inventory Accounts Receivable Prepaid Insurance Prepaid Licenses Total Current Assets Fixed Assets Buildings Leaseholder Improvements Less Amortization Equipment Less Depreciation Other fixed assets Total Fixed Assets Total Assets Liabilities Current Liabilities Notes Payable Accounts Payable Wages Payable Taxes Payable Unearned Revenue Total Current Liabilities Long-term Liabilities Notes payable Total Long-term Liabilities Total Liabilities Stockholders' Equity Common Stock Retained Earnings Total Stockholders' Equity Total Liabilities & Stockholders' Equity Does Total Assets = Total Liabilities & Stockholders' Equity? M8 M9 M10 M11 M12 Yr 1 Yr 2 Assets Current Assets Cash Inventory Accounts Receivable Prepaid Insurance Prepaid Licenses Total Current Assets Fixed Assets Buildings Leaseholder Improvements Less Amortization Equipment Less Depreciation Other fixed assets Total Fixed Assets Total Assets Liabilities Current Liabilities Notes Payable Accounts Payable Wages Payable Taxes Payable Unearned Revenue Total Current Liabilities Long-term Liabilities Notes payable Total Long-term Liabilities Total Liabilities Stockholders' Equity Common Stock Retained Earnings Total Stockholders' Equity Total Liabilities & Stockholders' Equity Does Total Assets = Total Liabilities & Stockholders' Equity? Yr 3 Assets Current Assets Cash Inventory Accounts Receivable Prepaid Insurance Prepaid Licenses Total Current Assets Fixed Assets Buildings Leaseholder Improvements Less Amortization Equipment Less Depreciation Other fixed assets Total Fixed Assets Total Assets Liabilities Current Liabilities Notes Payable Accounts Payable Wages Payable Taxes Payable Unearned Revenue Total Current Liabilities Long-term Liabilities Notes payable Total Long-term Liabilities Total Liabilities Stockholders' Equity Common Stock Retained Earnings Total Stockholders' Equity Total Liabilities & Stockholders' Equity Does Total Assets = Total Liabilities & Stockholders' Equity? Payment I Payment Principal Interest Total Interest Balance Month 1 $1,467.46 $1,061.21 $406.25 $406.25 $73,938.79 Month 2 $1,467.46 $1,066.96 $400.50 $806.75 $72,871.83 Month 3 $1,467.46 $1,072.74 $394.72 $1,201.47 $71,799.09 Month 4 $1,467.46 $1,078.55 $388.91 $1,590.39 $70,720.54 Month 5 $1,467.46 $1,084.39 $383.07 $1,973.46 $69,636.15 Month 6 $1,467.46 $1,090.27 $377.20 $2,350.65 $68,545.88 Month 7 $1,467.46 $1,096.17 $371.29 $2,721.94 $67,449.71 Month 8 $1,467.46 $1,102.11 $365.35 $3,087.29 $66,347.61 Month 9 $1,467.46 $1,108.08 $359.38 $3,446.68 $65,239.53 Month 10 $1,467.46 $1,114.08 $353.38 $3,800.06 $64,125.45 Month 11 $1,467.46 $1,120.11 $347.35 $4,147.40 $63,005.33 Month 12 $1,467.46 $1,126.18 $341.28 $4,488.68 $61,879.15 Month 13 $1,467.46 $1,132.28 $335.18 $4,823.86 $60,746.87 Month 14 $1,467.46 $1,138.42 $329.05 $5,152.91 $59,608.45 Month 15 $1,467.46 $1,144.58 $322.88 $5,475.79 $58,463.87 Month 16 $1,467.46 $1,150.78 $316.68 $5,792.47 $57,313.09 Month 17 $1,467.46 $1,157.02 $310.45 $6,102.91 $56,156.07 Month 18 $1,467.46 $1,163.28 $304.18 $6,407.09 $54,992.79 Month 19 $1,467.46 $1,169.58 $297.88 $6,704.97 $53,823.21 Month 20 $1,467.46 $1,175.92 $291.54 $6,996.51 $52,647.29 Month 21 $1,467.46 $1,182.29 $285.17 $7,281.68 $51,465.00 Month 22 $1,467.46 $1,188.69 $278.77 $7,560.45 $50,276.31 Month 23 $1,467.46 $1,195.13 $272.33 $7,832.78 $49,081.18 Month 24 $1,467.46 $1,201.60 $265.86 $8,098.64 $47,879.57 Month 25 $1,467.46 $1,208.11 $259.35 $8,357.99 $46,671.46 Month 26 $1,467.46 $1,214.66 $252.80 $8,610.79 $45,456.80 Month 27 $1,467.46 $1,221.24 $246.22 $8,857.01 $44,235.56 Month 28 $1,467.46 $1,227.85 $239.61 $9,096.62 $43,007.71 Month 29 $1,467.46 $1,234.50 $232.96 $9,329.58 $41,773.21 Month 30 $1,467.46 $1,241.19 $226.27 $9,555.85 $40,532.02 Month 31 $1,467.46 $1,247.91 $219.55 $9,775.40 $39,284.11 M10 M11 M12 Yr 1 Yr 2 Yr 3 M9 Cash From Operations Net Income Depreciation Amortization Change in Working Capital Net Cash from Operations Cash From Investing Equipment Purchased Other asset purchases Equipment Sold Renovations Other sale of assets Net Cash from Investing Cash From Financing Equity Income Equity Dispursement Debt Income Debt Dispursement Net Cash from Financing Change in Cash Starting Cash Ending Cash
Step by Step Solution
There are 3 Steps involved in it

Get step-by-step solutions from verified subject matter experts