

Question: Old MathJax webview Old MathJax webview Make up a number Well then, dont do it.... For this week calculate the following ratios for the last
Old MathJax webview
Make up a number
Well then, dont do it....
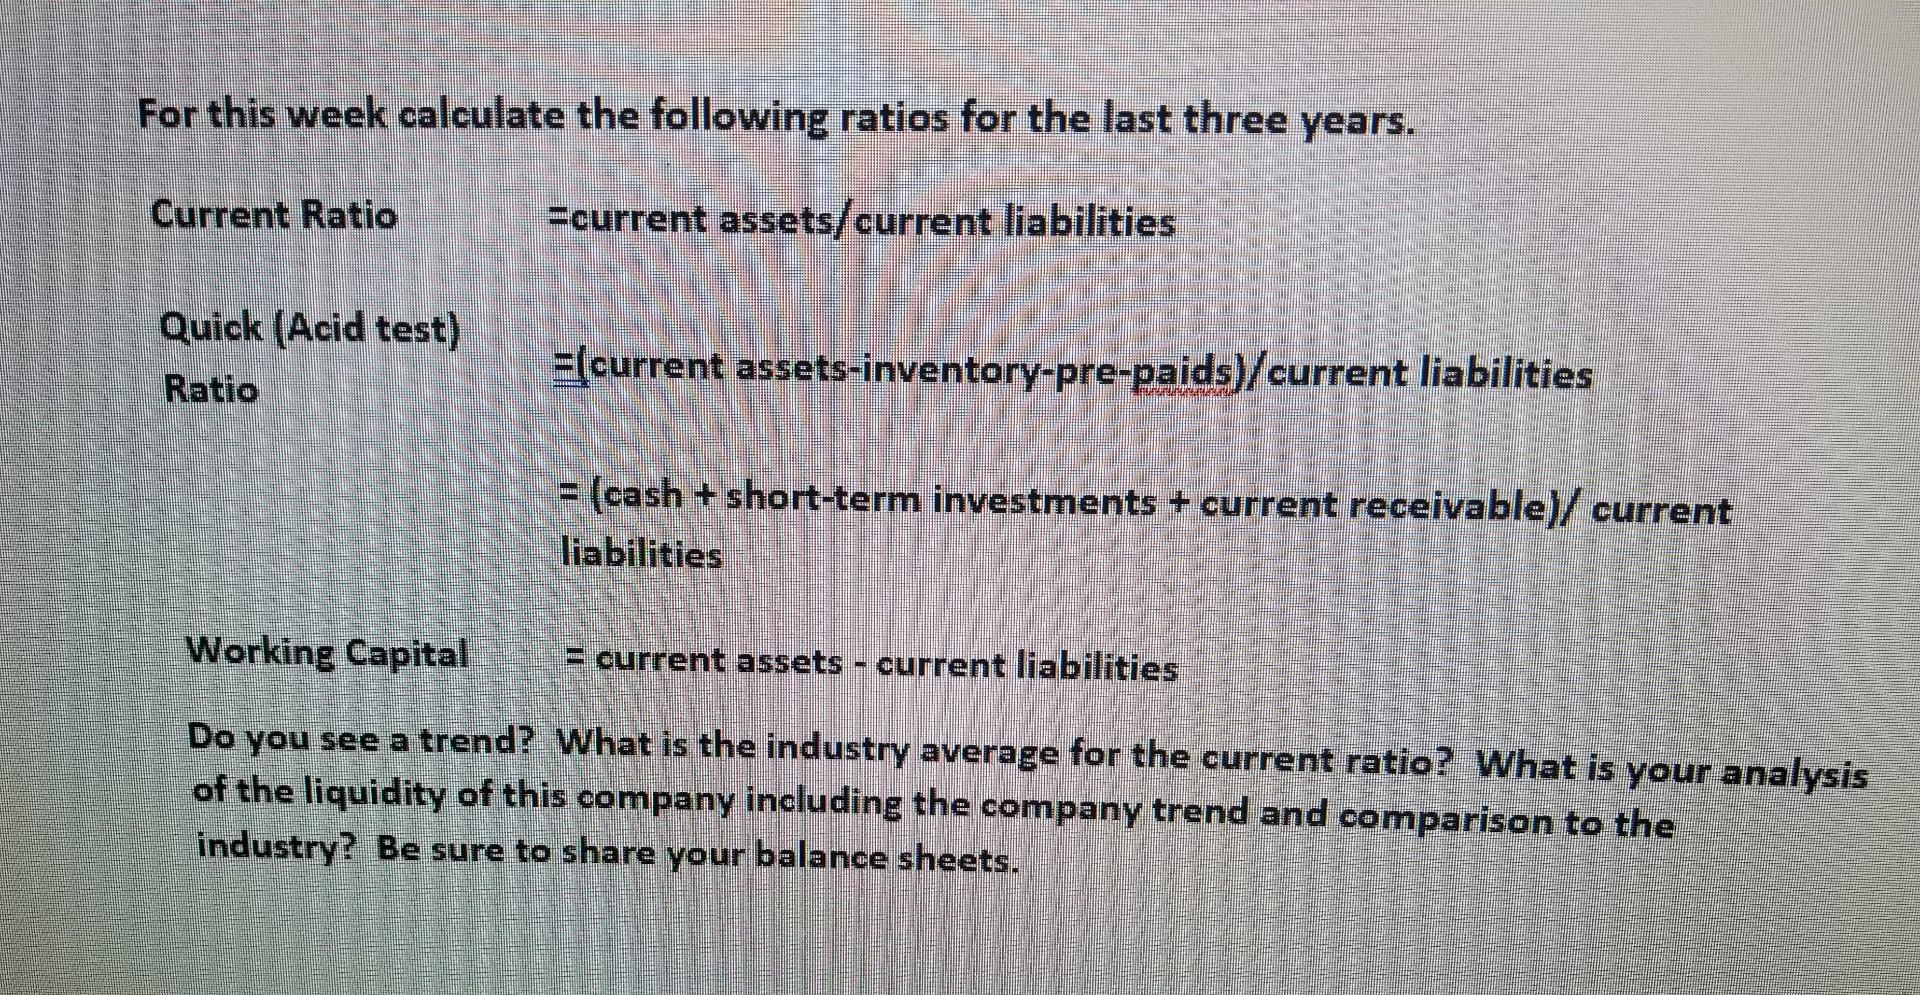
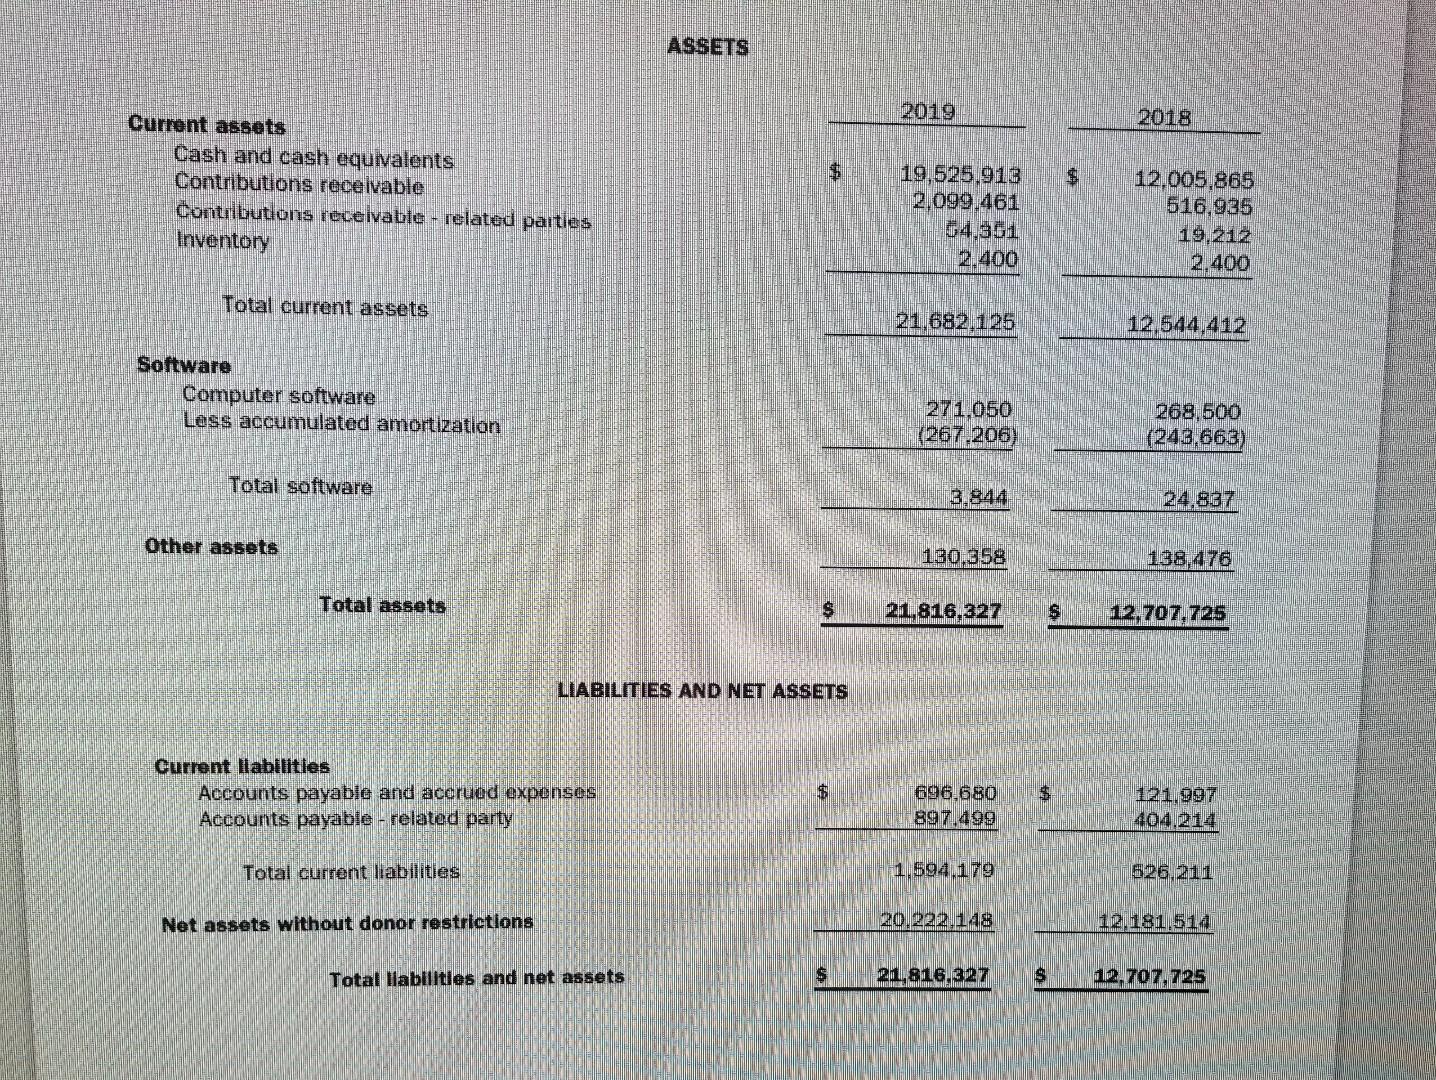
For this week calculate the following ratios for the last three years. Current Ratio =current assets/current liabilities Quick (Acid test) E{current assets-inventory-pre-paids current liabilities Ratio . = {cash + short-term investments + current receivable)/ current liabilities Working Capital = current assets - current liabilities Do you see a trend? What is the industry average for the current ratio? What is your analysis of the liquidity of this company including the company trend and comparison to the industry? Be sure to share your balance sheets. ASSETS 2019 $ Current assets Cash and cash equivalents Contributions receivable Contributions receivable - related parties Inventory 19,525.913 2.099.461 54.361 2.400 12,005.865 516,935 19.212 2.400 Total current assets 21,682 125 12,544,412 Software Computer software Less accumulated amortization 271,050 (267,206) 1268,500 (243,663) Total software 3.844 24.837 Other assets 130.358 138, 476 Total assets $ 21,816,327 S 12.707.725 LIABILITIES AND NET ASSETS Current labilities Accounts payable and accrued expenses Accounts payable - related party $ $ 696.680 897.499 121.997 404.214 Total current liabilities 1.594,179 526,211 Net assets without donor restrictions 20.222.148 12.181.512 Total Habilities and net assets $ 21,816.327 S 12.707.725 For this week calculate the following ratios for the last three years. Current Ratio =current assets/current liabilities Quick (Acid test) E{current assets-inventory-pre-paids current liabilities Ratio . = {cash + short-term investments + current receivable)/ current liabilities Working Capital = current assets - current liabilities Do you see a trend? What is the industry average for the current ratio? What is your analysis of the liquidity of this company including the company trend and comparison to the industry? Be sure to share your balance sheets. ASSETS 2019 $ Current assets Cash and cash equivalents Contributions receivable Contributions receivable - related parties Inventory 19,525.913 2.099.461 54.361 2.400 12,005.865 516,935 19.212 2.400 Total current assets 21,682 125 12,544,412 Software Computer software Less accumulated amortization 271,050 (267,206) 1268,500 (243,663) Total software 3.844 24.837 Other assets 130.358 138, 476 Total assets $ 21,816,327 S 12.707.725 LIABILITIES AND NET ASSETS Current labilities Accounts payable and accrued expenses Accounts payable - related party $ $ 696.680 897.499 121.997 404.214 Total current liabilities 1.594,179 526,211 Net assets without donor restrictions 20.222.148 12.181.512 Total Habilities and net assets $ 21,816.327 S 12.707.725
Step by Step Solution
There are 3 Steps involved in it

Get step-by-step solutions from verified subject matter experts