

Question: Old MathJax webview Old MathJax webview Old MathJax webview Transportation Planning course. please Calculate 1. traffic survey, 2.traffic survey Table and show histogram, map and
Old MathJax webview
Old MathJax webview
Old MathJax webview
Transportation Planning course.
please
Calculate 1. traffic survey, 2.traffic survey Table and show histogram, map and discuss the results. 3. load profile Pk, also calculate sheet for AADT for desigin .
please calculate these questions traffic survey question
engineering transportation planning survey please calculate it in your own city.
Civil Engineering
calculate these questions
Transport Engineering planning and survey
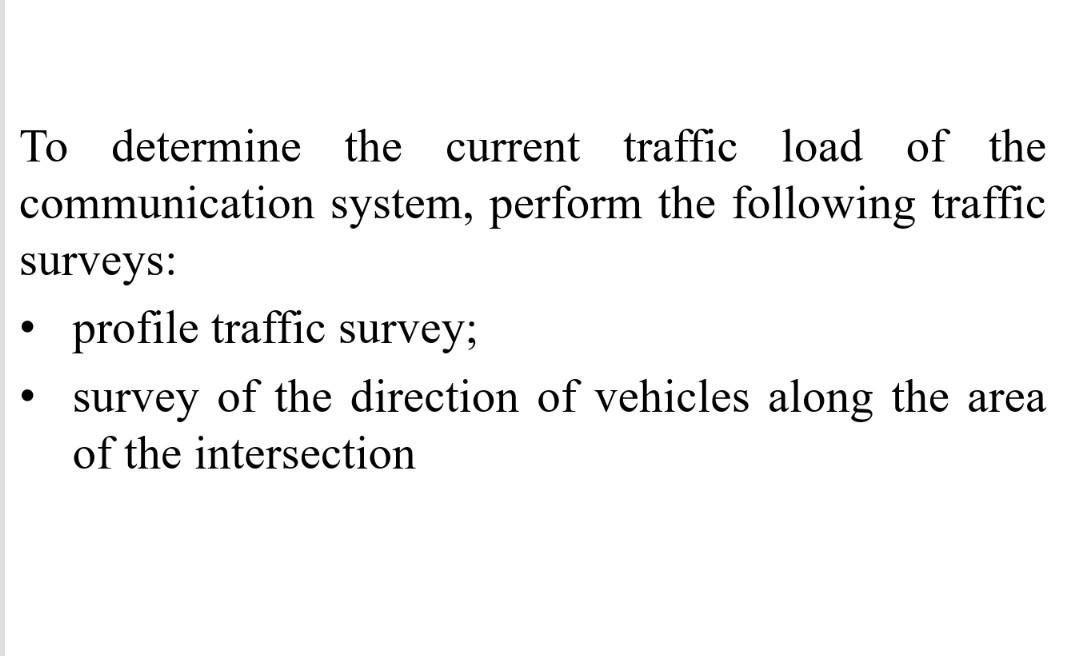
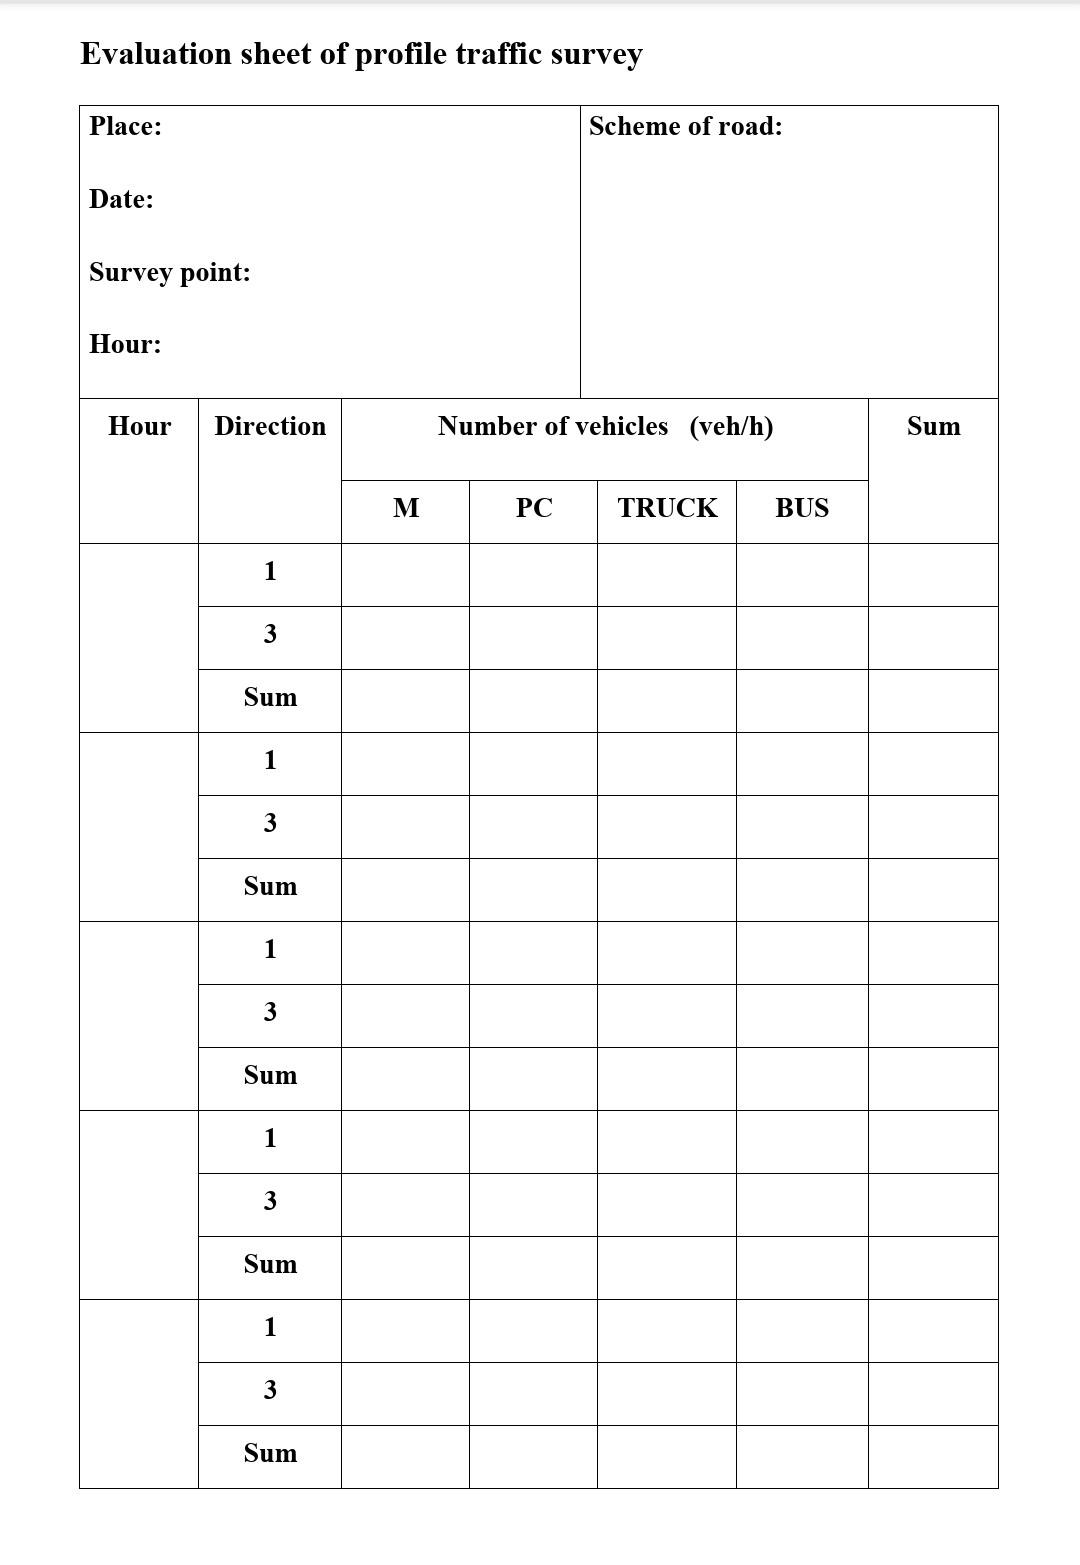
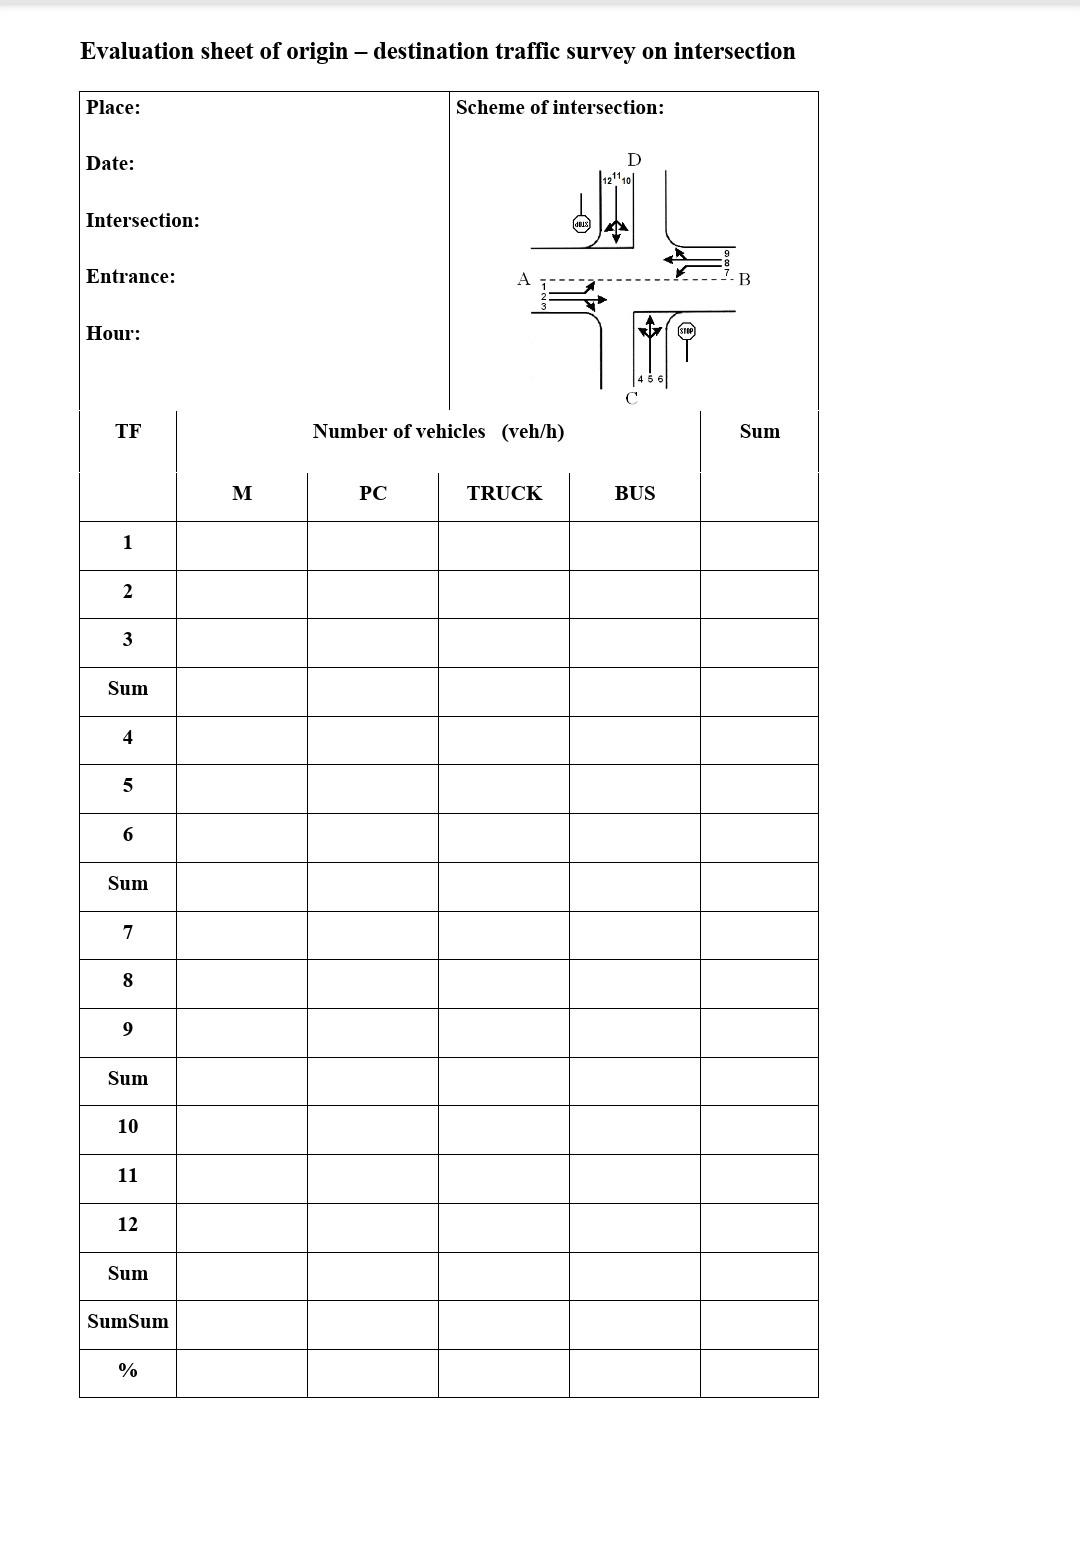
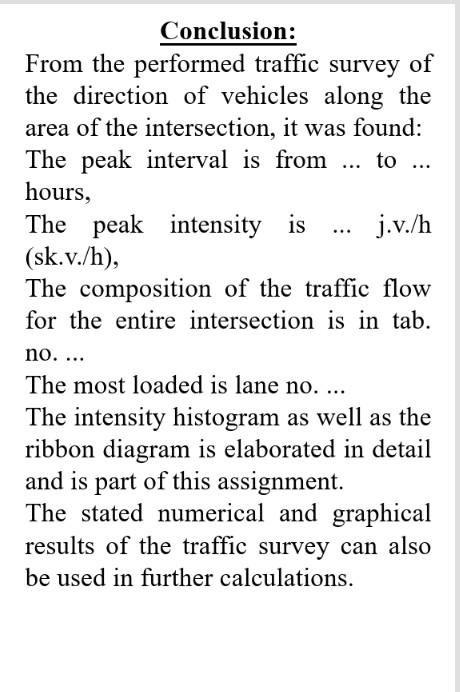
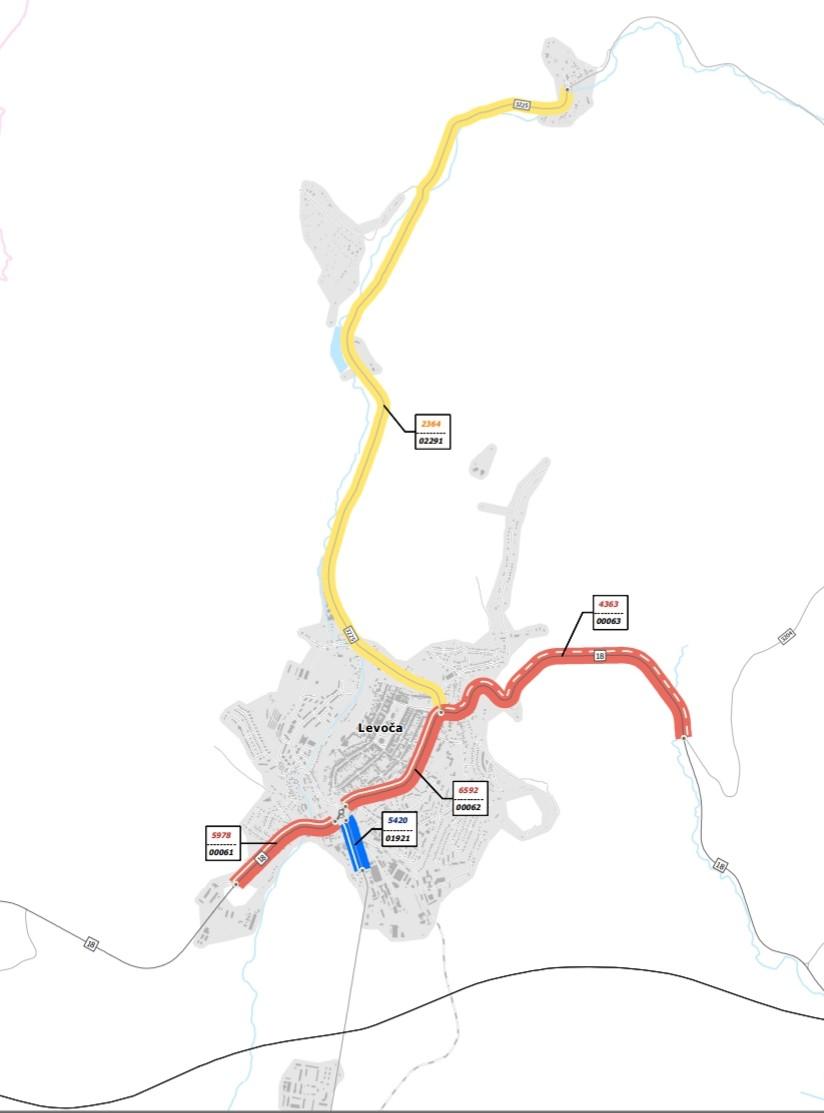
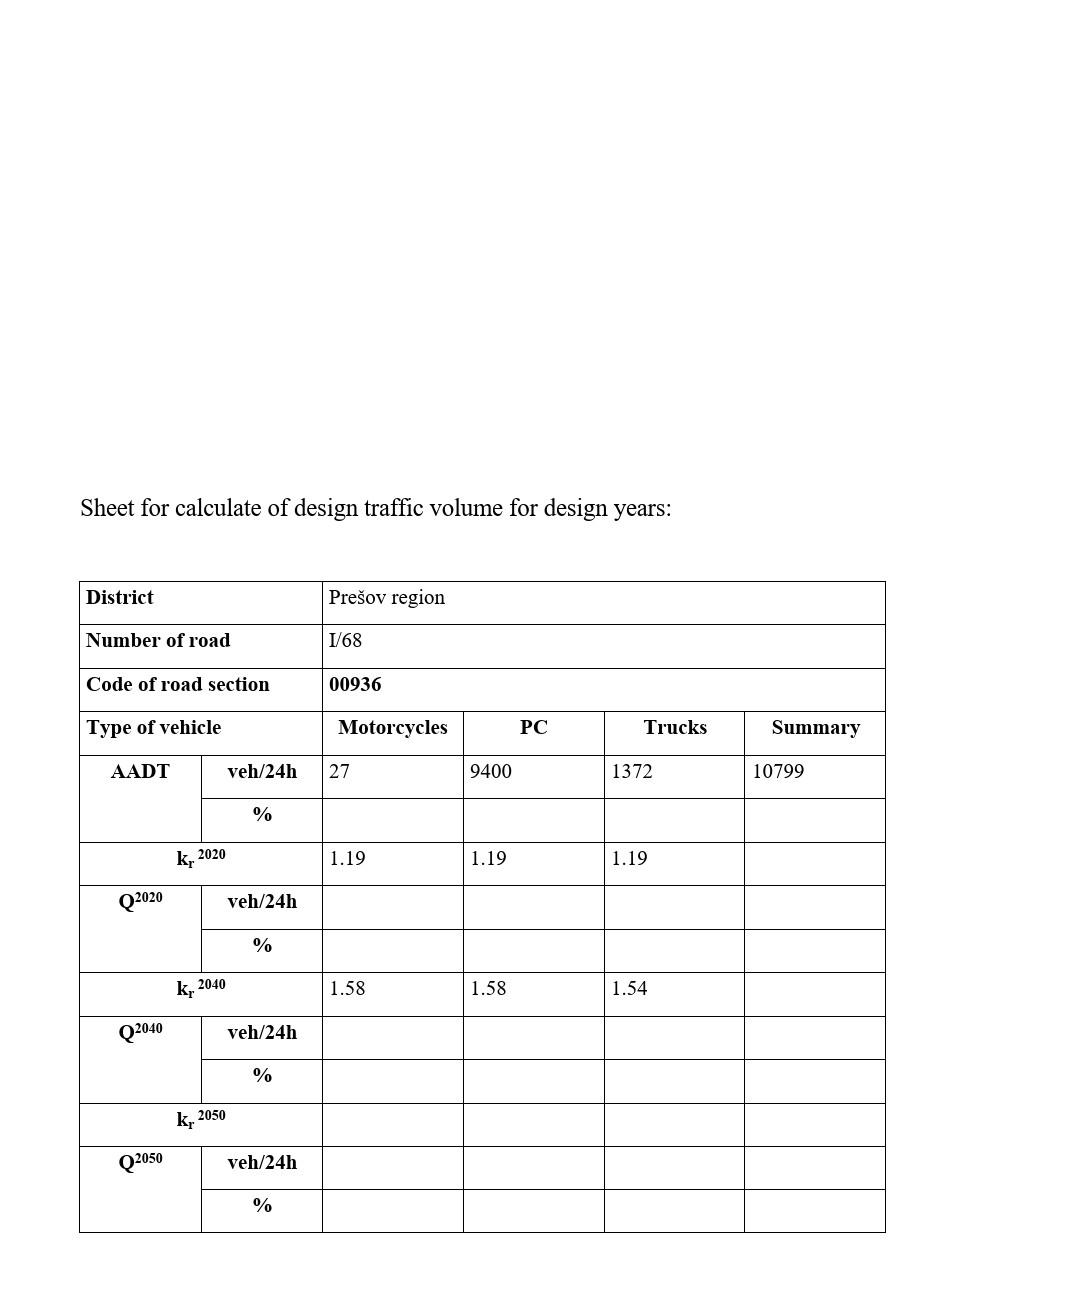
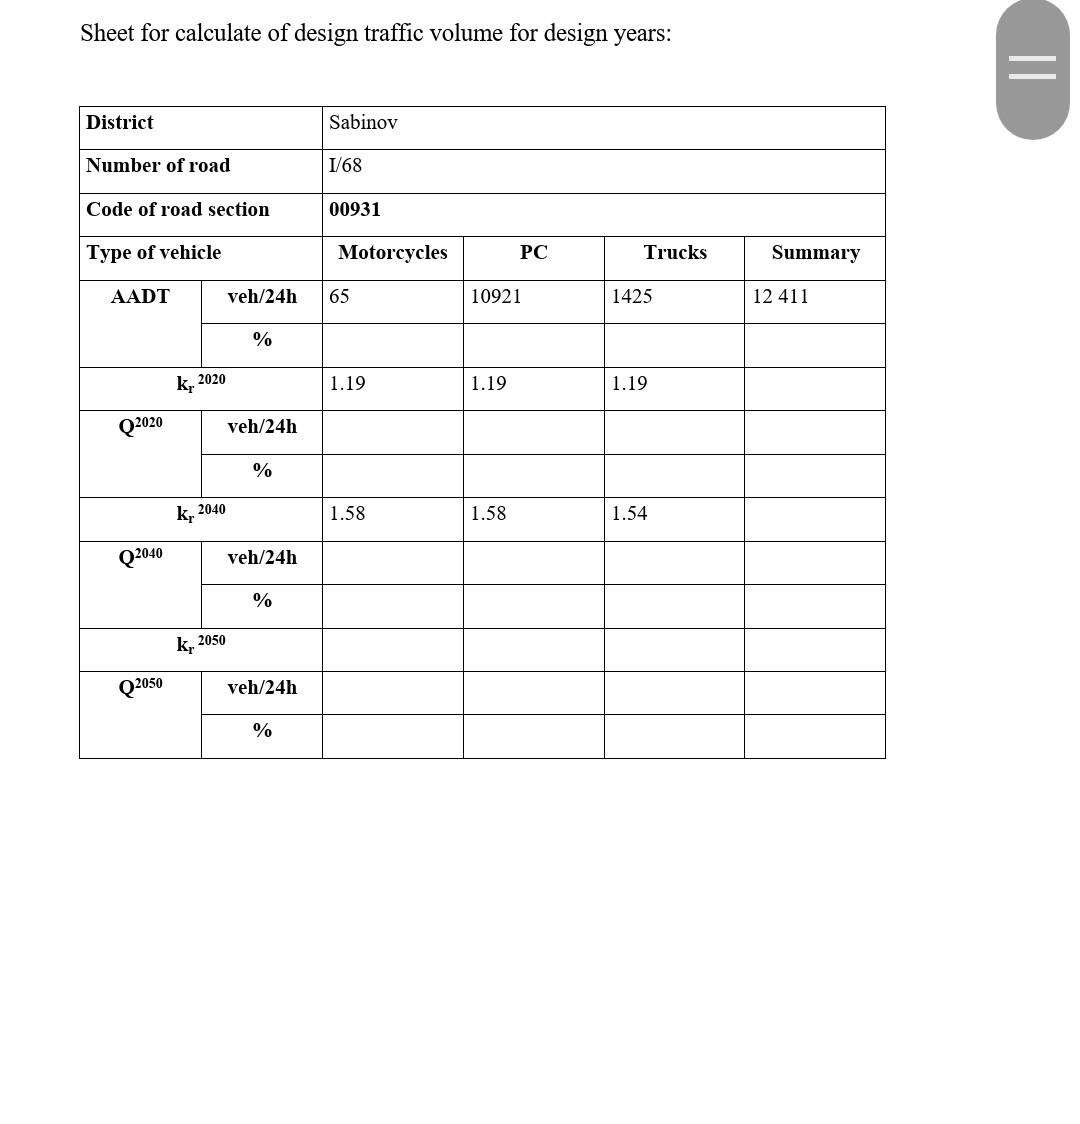
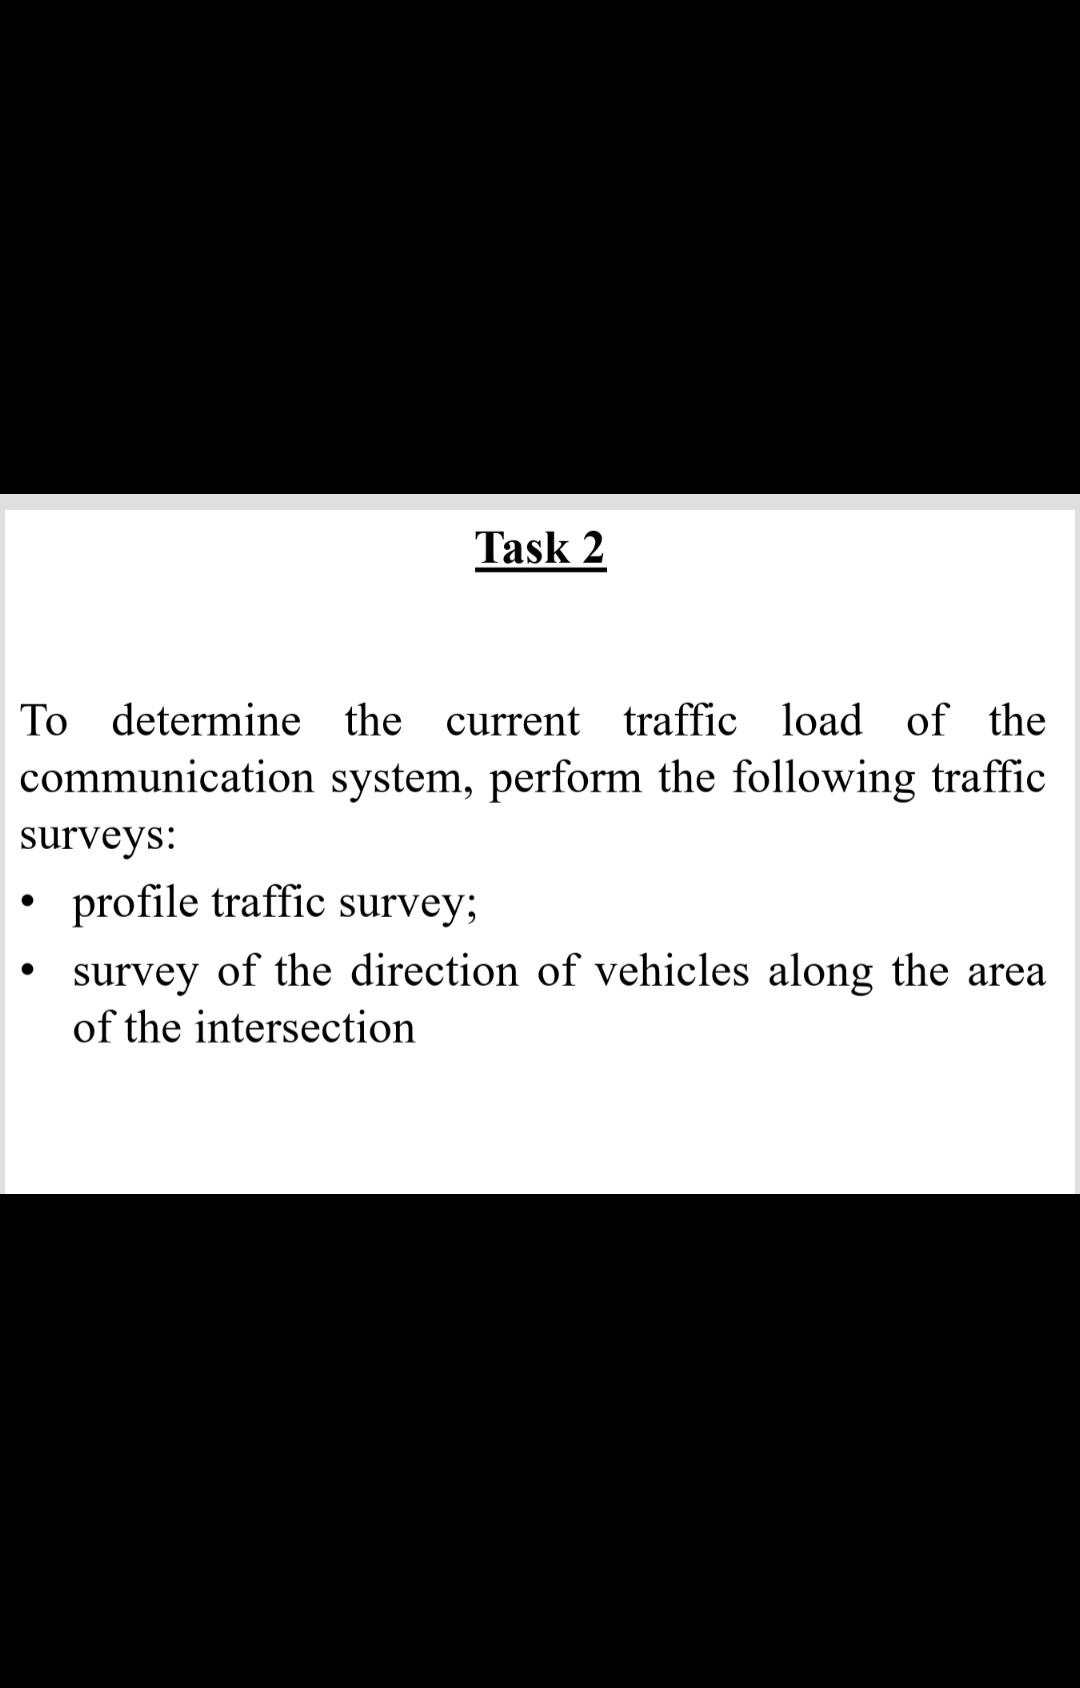
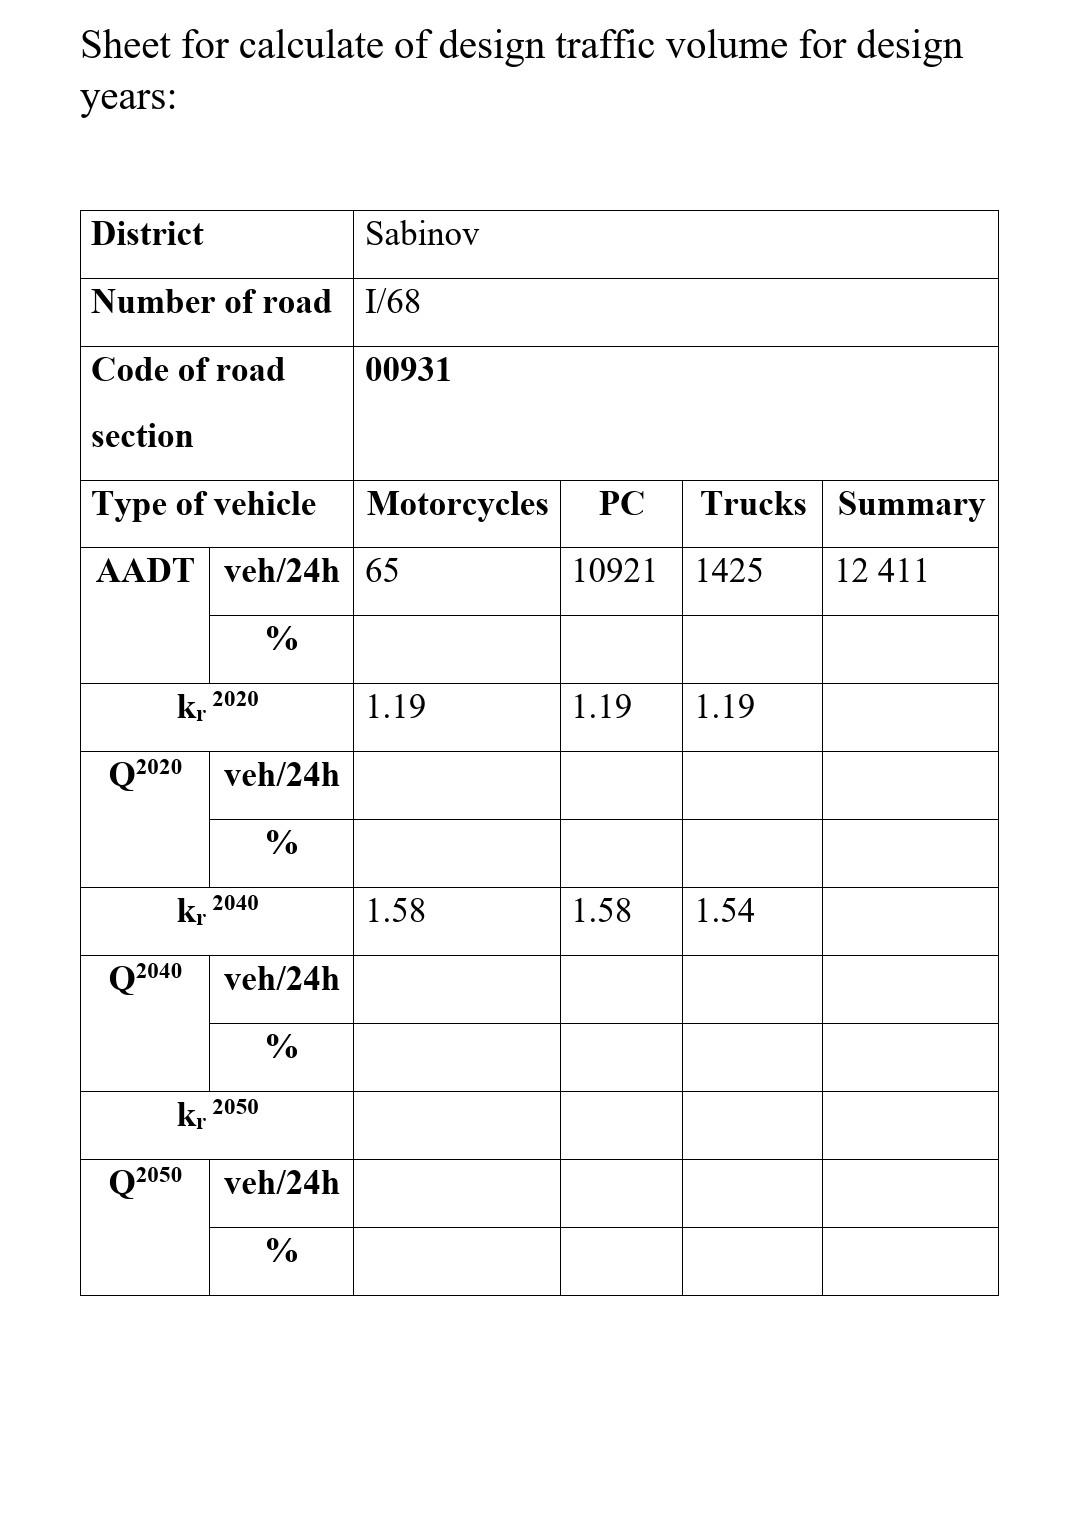
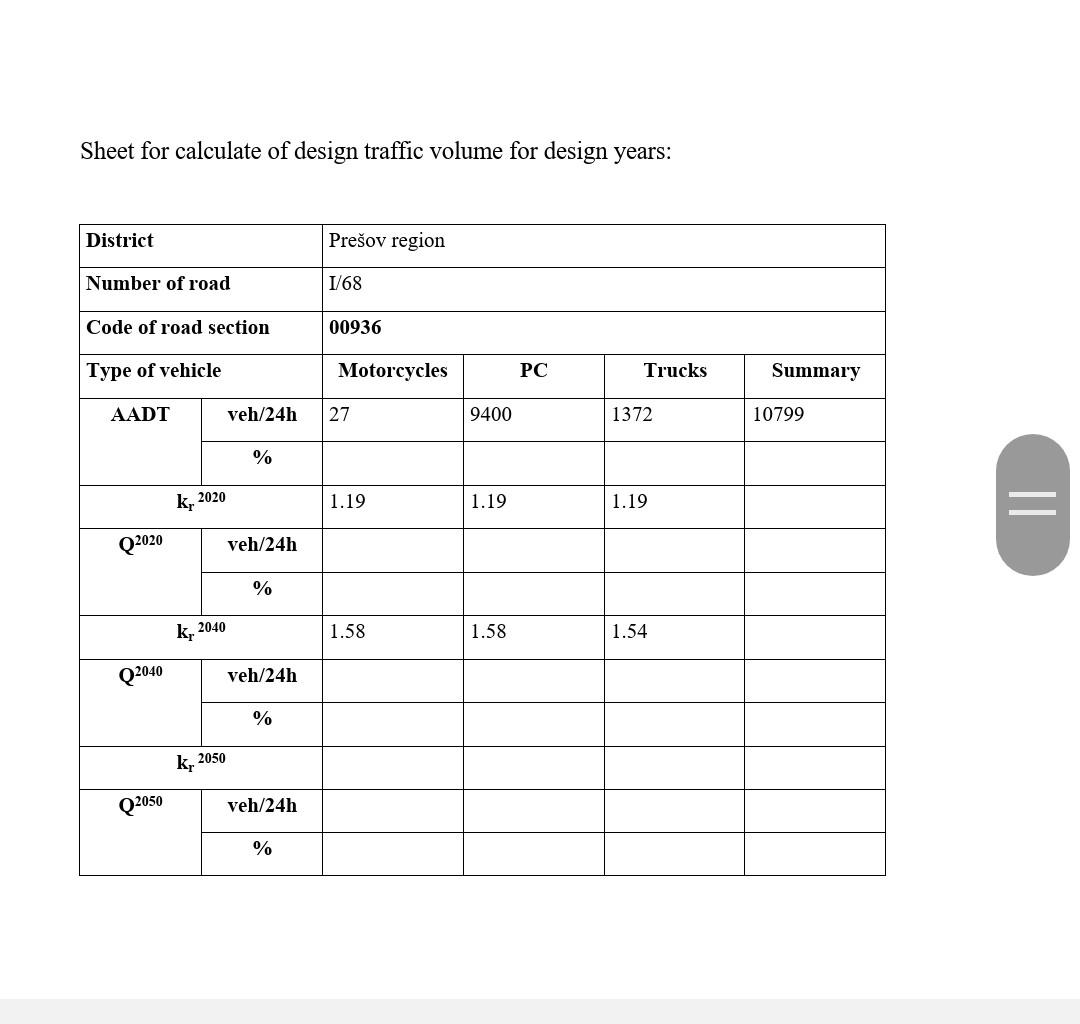
To determine the current traffic load of the communication system, perform the following traffic surveys: profile traffic survey; survey of the direction of vehicles along the area of the intersection . Evaluation sheet of profile traffic survey Place: Scheme of road: Date: Survey point: Hour: Hour Direction Number of vehicles (veh/h) Sum M PC TRUCK BUS 1 3 Sum 1 3 Sum 1 3 Sum 1 3 Sum 1 3 Sum Evaluation sheet of origin destination traffic survey on intersection Place: Scheme of intersection: Date: D 121,01 Intersection: Entrance: B Hour: TF Number of vehicles (veh/h) Sum M PC TRUCK BUS 1 2 3 Sum 4 5 6 Sum 7 8 9 Sum 10 11 12 Sum SumSum % In the end describes: What was done in the assignment and what results were achieved.. ... Conclusion: From the performed traffic survey of the direction of vehicles along the area of the intersection, it was found: The peak interval is from ... to ... hours, The peak intensity is j.v./h (sk.v./h), The composition of the traffic flow for the entire intersection is in tab. no.... The most loaded is lane no. ... The intensity histogram as well as the ribbon diagram is elaborated in detail and is part of this assignment. The stated numerical and graphical results of the traffic survey can also be used in further calculations. Levoa 1978 Sheet for calculate of design traffic volume for design years: District Preov region Number of road 1/68 Code of road section 00936 Type of vehicle Motorcycles PC Trucks Summary AADT veh/24h 27 9400 1372 10799 % k, 2020 1.19 1.19 1.19 Q2020 veh/24h % k, 2040 1.58 1.58 1.54 Q2040 veh/24h % k, 2050 Q2050 veh/24h % Sheet for calculate of design traffic volume for design years: = District Sabinov Number of road 1/68 Code of road section 00931 Type of vehicle Motorcycles PC Trucks Summary AADT veh/24h 65 10921 1425 12 411 % k, 2020 1.19 1.19 1.19 Q2020 veh/24h % kr 2040 1.58 1.58 1.54 Q2040 veh/24h % kr 2050 Q2050 veh/24h % Task 2 To determine the current traffic load of the communication system, perform the following traffic surveys: profile traffic survey; survey of the direction of vehicles along the area of the intersection Sheet for calculate of design traffic volume for design years: District Sabinov Number of road 1/68 Code of road 00931 section Type of vehicle Motorcycles PC Trucks Summary AADT veh/24h 65 10921 1425 12 411 % k, 2020 1.19 1.19 1.19 Q2020 veh/24h % k. 2040 1.58 1.58 1.54 Q2040 veh/24h % k, 2050 Q2050 veh/24h % Sheet for calculate of design traffic volume for design years: District Preov region Number of road 1/68 Code of road section 00936 Type of vehicle Motorcycles PC Trucks Summary AADT veh/24h 27 9400 1372 10799 % k, 2020 1.19 1.19 1.19 II Q2020 veh/24h % k, 2040 1.58 1.58 1.54 Q2040 veh/24h % k, 2050 Q2050 veh/24h % To determine the current traffic load of the communication system, perform the following traffic surveys: profile traffic survey; survey of the direction of vehicles along the area of the intersection . Evaluation sheet of profile traffic survey Place: Scheme of road: Date: Survey point: Hour: Hour Direction Number of vehicles (veh/h) Sum M PC TRUCK BUS 1 3 Sum 1 3 Sum 1 3 Sum 1 3 Sum 1 3 Sum Evaluation sheet of origin destination traffic survey on intersection Place: Scheme of intersection: Date: D 121,01 Intersection: Entrance: B Hour: TF Number of vehicles (veh/h) Sum M PC TRUCK BUS 1 2 3 Sum 4 5 6 Sum 7 8 9 Sum 10 11 12 Sum SumSum % In the end describes: What was done in the assignment and what results were achieved.. ... Conclusion: From the performed traffic survey of the direction of vehicles along the area of the intersection, it was found: The peak interval is from ... to ... hours, The peak intensity is j.v./h (sk.v./h), The composition of the traffic flow for the entire intersection is in tab. no.... The most loaded is lane no. ... The intensity histogram as well as the ribbon diagram is elaborated in detail and is part of this assignment. The stated numerical and graphical results of the traffic survey can also be used in further calculations. Levoa 1978 Sheet for calculate of design traffic volume for design years: District Preov region Number of road 1/68 Code of road section 00936 Type of vehicle Motorcycles PC Trucks Summary AADT veh/24h 27 9400 1372 10799 % k, 2020 1.19 1.19 1.19 Q2020 veh/24h % k, 2040 1.58 1.58 1.54 Q2040 veh/24h % k, 2050 Q2050 veh/24h % Sheet for calculate of design traffic volume for design years: = District Sabinov Number of road 1/68 Code of road section 00931 Type of vehicle Motorcycles PC Trucks Summary AADT veh/24h 65 10921 1425 12 411 % k, 2020 1.19 1.19 1.19 Q2020 veh/24h % kr 2040 1.58 1.58 1.54 Q2040 veh/24h % kr 2050 Q2050 veh/24h % Task 2 To determine the current traffic load of the communication system, perform the following traffic surveys: profile traffic survey; survey of the direction of vehicles along the area of the intersection Sheet for calculate of design traffic volume for design years: District Sabinov Number of road 1/68 Code of road 00931 section Type of vehicle Motorcycles PC Trucks Summary AADT veh/24h 65 10921 1425 12 411 % k, 2020 1.19 1.19 1.19 Q2020 veh/24h % k. 2040 1.58 1.58 1.54 Q2040 veh/24h % k, 2050 Q2050 veh/24h % Sheet for calculate of design traffic volume for design years: District Preov region Number of road 1/68 Code of road section 00936 Type of vehicle Motorcycles PC Trucks Summary AADT veh/24h 27 9400 1372 10799 % k, 2020 1.19 1.19 1.19 II Q2020 veh/24h % k, 2040 1.58 1.58 1.54 Q2040 veh/24h % k, 2050 Q2050 veh/24h %Step by Step Solution
There are 3 Steps involved in it
1 Expert Approved Answer
Step: 1 Unlock

Question Has Been Solved by an Expert!
Get step-by-step solutions from verified subject matter experts
Step: 2 Unlock
Step: 3 Unlock