

Question: Old MathJax webview Old MathJax webview please help here is problem.1 2. The Forever Young Cosmetics Company used forecast model 2 to forecast demand for
Old MathJax webview
Old MathJax webview
please help

here is problem.1
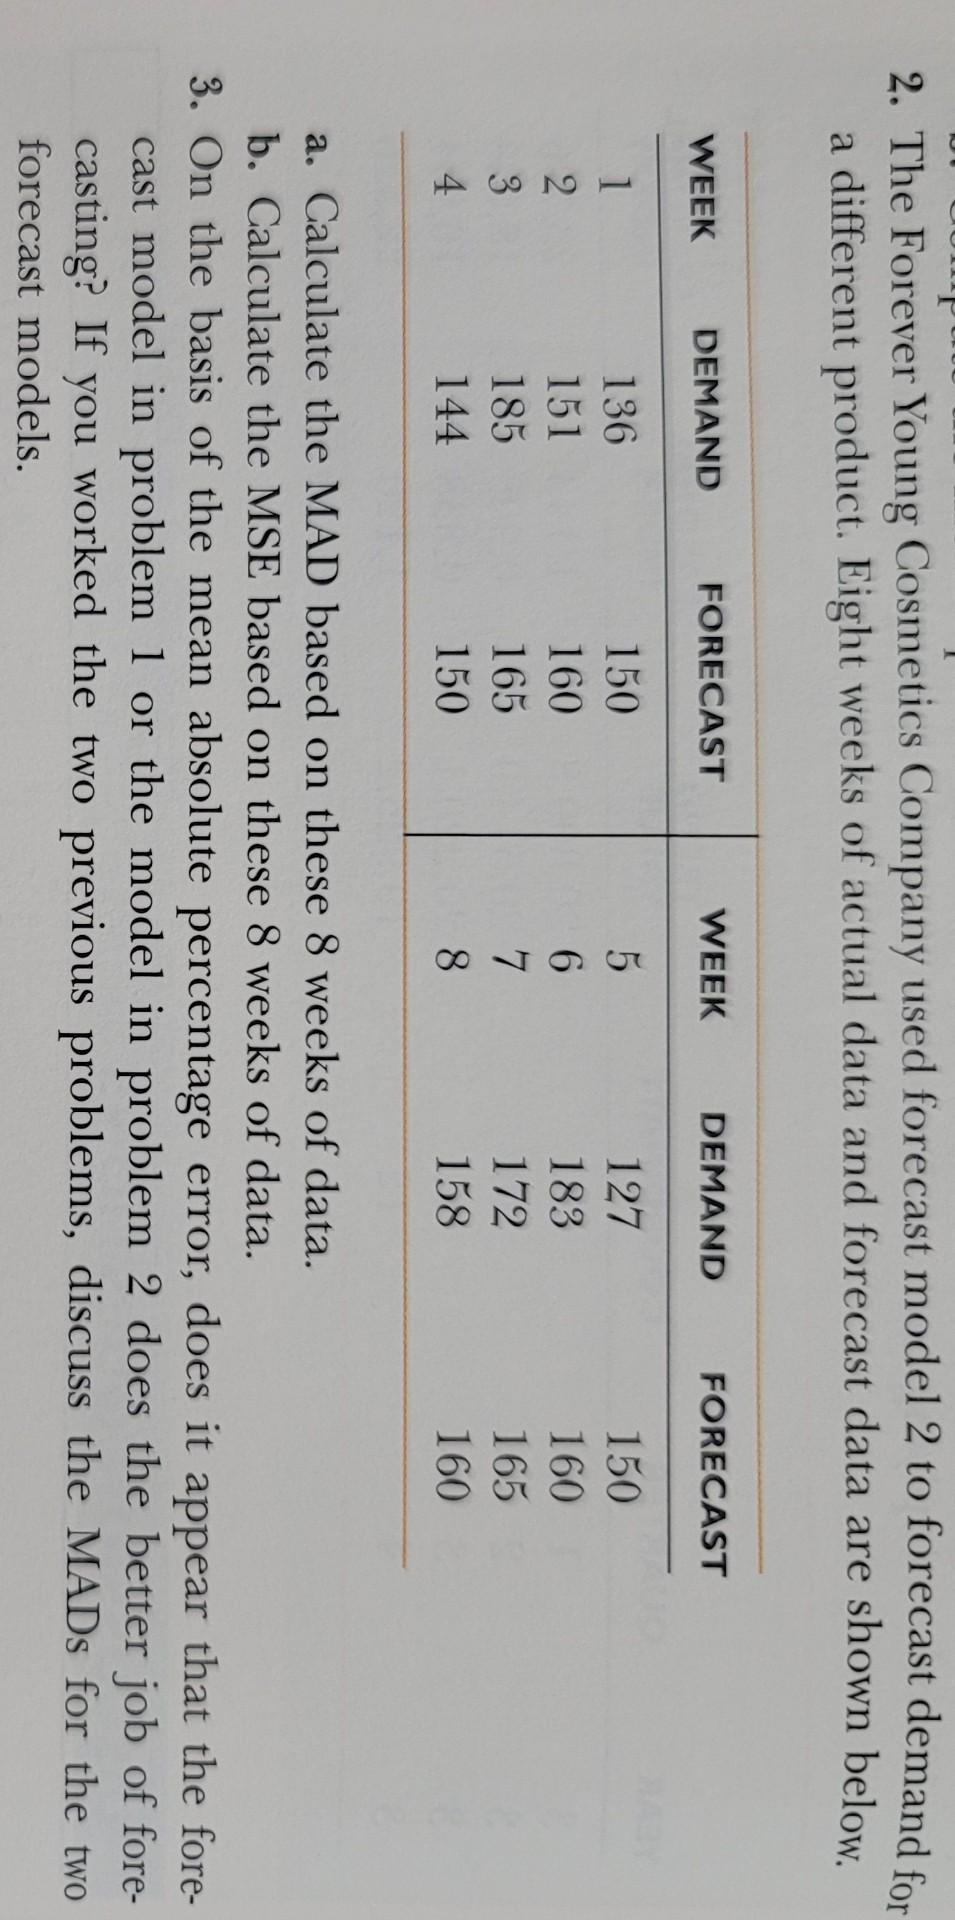
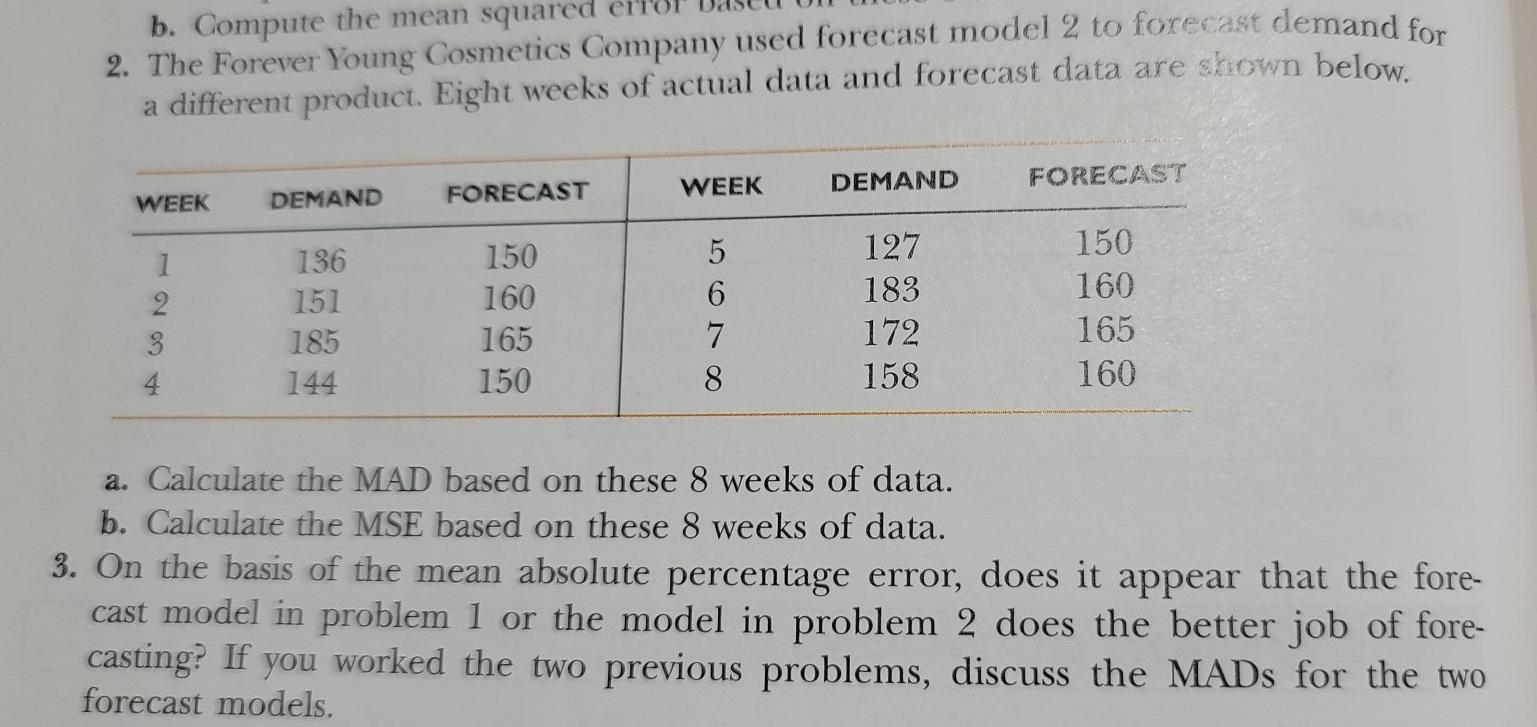
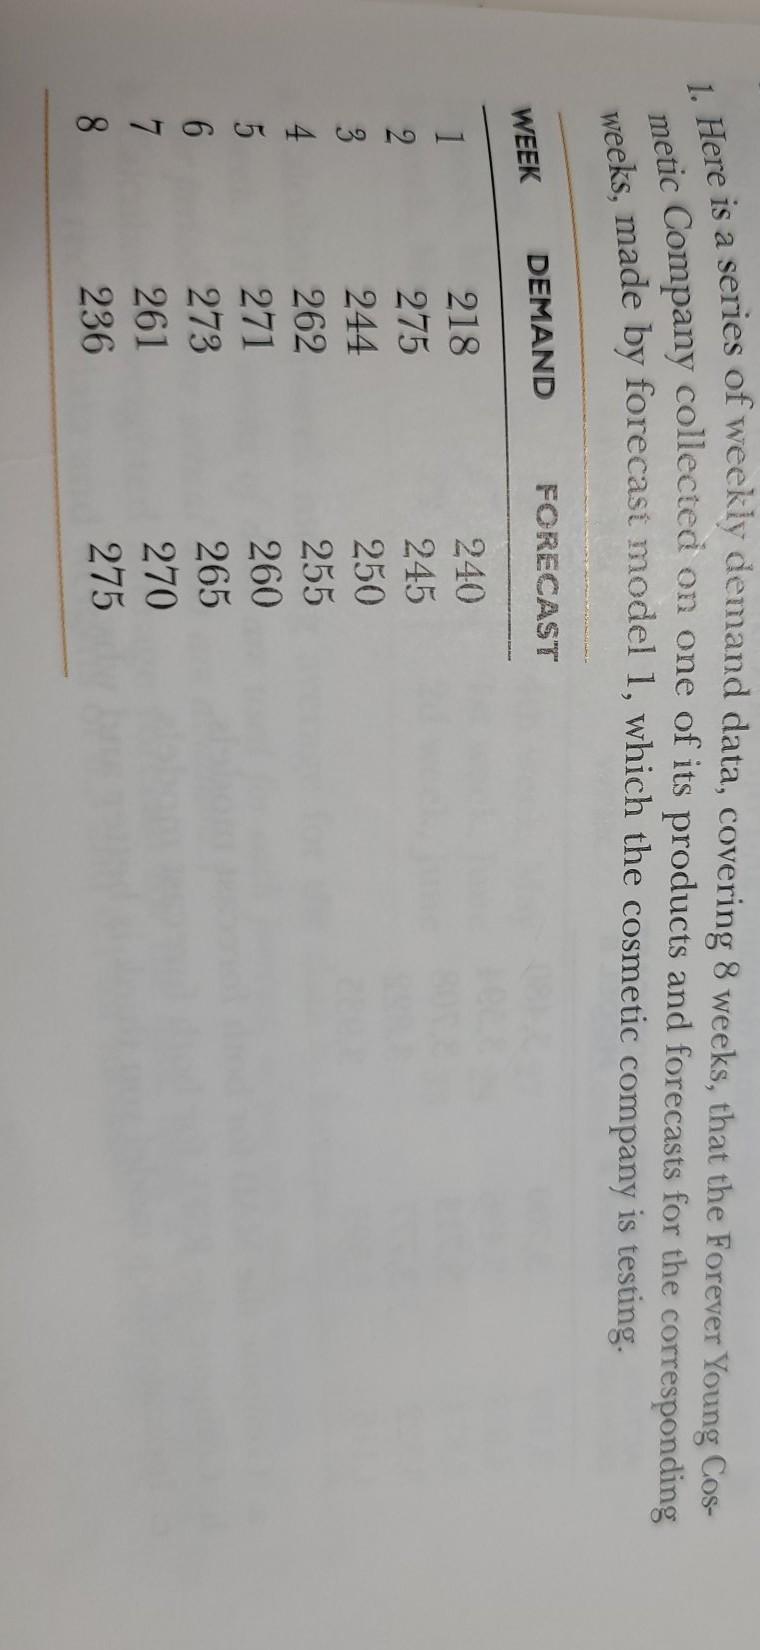
2. The Forever Young Cosmetics Company used forecast model 2 to forecast demand for a different product. Eight weeks of actual data and forecast data are shown below. WEEK DEMAND FORECAST WEEK DEMAND FORECAST 5. 1 2 3 4 136 151 185 144 150 160 165 150 6. 7. 8 127 183 172 158 150 160 165 160 a. Calculate the MAD based on these 8 weeks of data. b. Calculate the MSE based on these 8 weeks of data. 3. On the basis of the mean absolute percentage error, does it appear that the fore- cast model in problem 1 or the model in problem 2 does the better job of fore- casting? If you worked the two previous problems, discuss the MADs for the two forecast models. b. Compute the mean squared erre 2. The Forever Young Cosmetics Company used forecast model 2 to forecast demand for a different product. Eight weeks of actual data and forecast data are shown below. WEEK DEMAND FORECAST WEEK DEMAND FORECAST 1 2 3 136 151 185 144 150 160 165 150 5 6 7 8 127 183 172 158 150 160 165 160 a. Calculate the MAD based on these 8 weeks of data. b. Calculate the MSE based on these 8 weeks of data. 3. On the basis of the mean absolute percentage error, does it appear that the fore- cast model in problem 1 or the model in problem 2 does the better job of fore- casting? If you worked the two previous problems, discuss the MADs for the two forecast models. 1. Here is a series of weekly demand data, covering 8 weeks, that the Forever Young Cos- weeks, made by forecast model 1, which the cosmetic company is testing. hetic Company collected on one of its products and forecasts for the corresponding DEMAND FORECAST WEEK 1 2 3 4 5 6 7 8 218 275 244 262 271 273 261 236 240 245 250 255 260 265 270 275 a. Compute the mean absolute deviation based on all 8 weeks of data. b. Compute the mean squared error based on these 3 weeks of dataStep by Step Solution
There are 3 Steps involved in it
1 Expert Approved Answer
Step: 1 Unlock

Question Has Been Solved by an Expert!
Get step-by-step solutions from verified subject matter experts
Step: 2 Unlock
Step: 3 Unlock