

Question: Old MathJax webview Old MathJax webview please zoom image image is clear . please solve it within 2 hours I will Upvote you Please solve
Old MathJax webview
Old MathJax webview
please zoom image image is clear . please solve it within 2 hours I will Upvote you
Please solve it within 1 hour image is clear now zoom image
please solve it within 30 minutes please
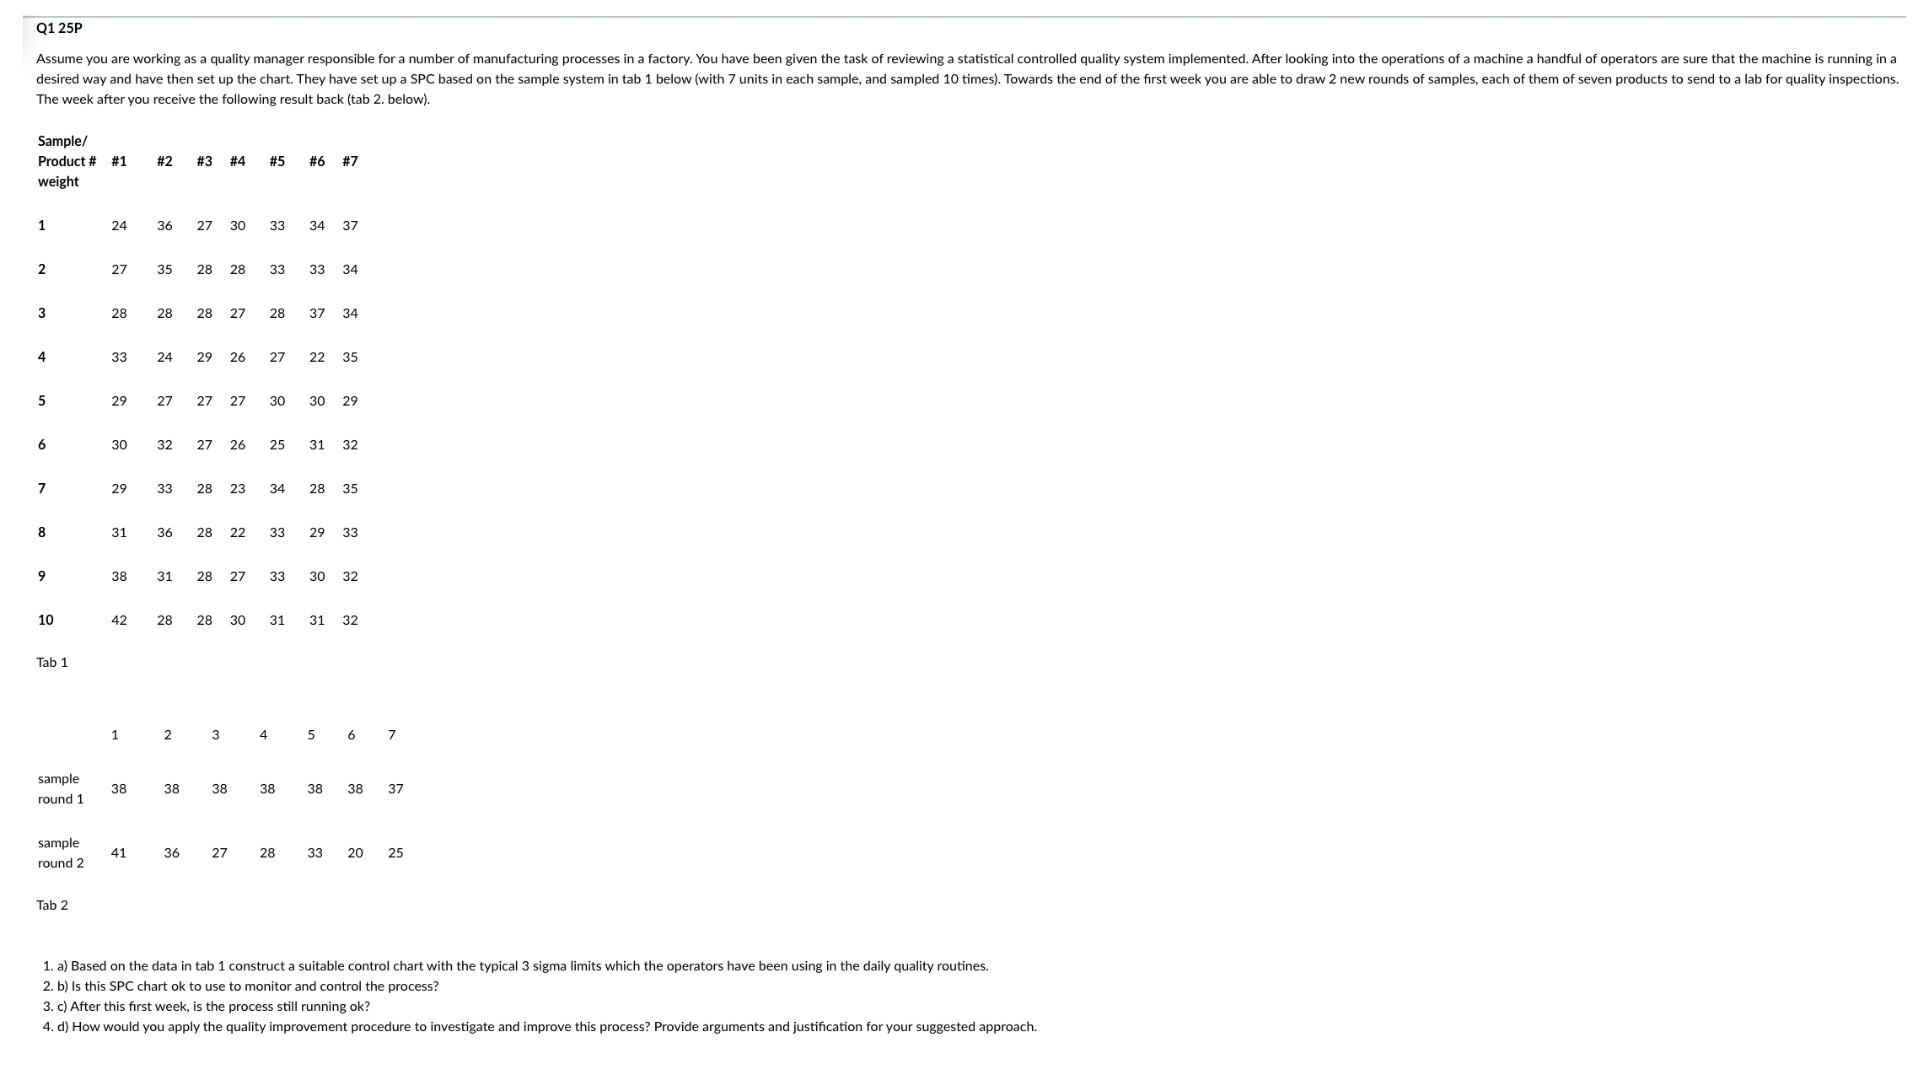
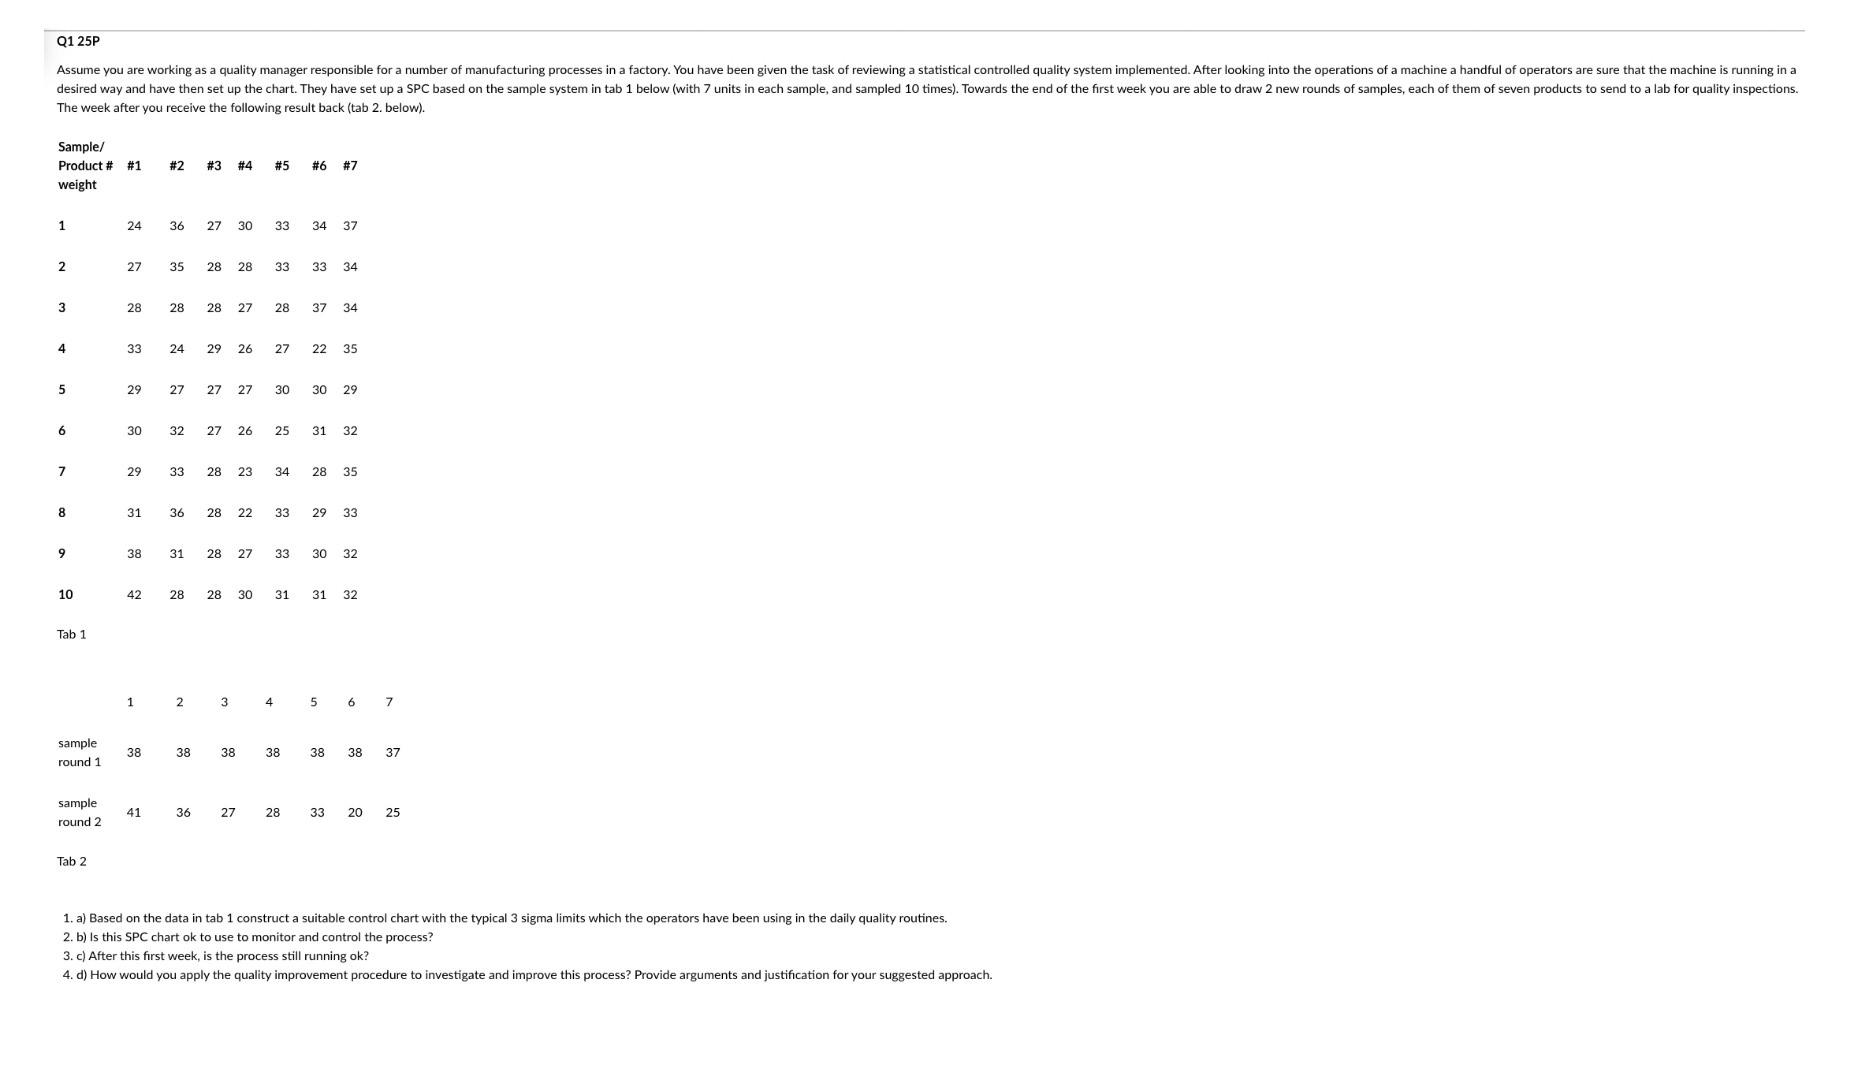
Q1 25P Assume you are working as a quality manager responsible for a number of manufacturing processes in a factory. You have been given the task of reviewing a statistical controlled quality system implemented. After looking into the operations of a machine a handful of operators are sure that the machine is running in a desired way and have then set up the chart. They have set up a SPC based on the sample system in tab 1 below (with 7 units in each sample, and sampled 10 times). Towards the end of the first week you are able to draw 2 new rounds of samples, each of them of seven products to send to a lab for quality inspections. The week after you receive the following result back (tab 2. below). Sample/ Product # weight #1 1 #2 #3 #4 #5 #6 #7 1 24 36 27 30 33 34 37 2 27 35 28 28 33 33 34 3 28 28 28 27 28 37 34 4 33 24 29 26 27 22 35 5 29 27 27 27 30 30 29 6 30 32 27 26 25 31 32 7 29 33 28 23 34 28 35 8 31 36 28 22 33 29 33 9 38 31 28 27 33 30 32 10 42 28 28 30 31 31 32 Tab 1 1 2 3 4 5 6 7 sample round 1 38 38 38 38 38 38 37 sample round 2 41 36 27 28 33 20 25 Tab 2 1. a) Based on the data in tab 1 construct a suitable control chart with the typical 3 sigma limits which the operators have been using in the daily quality routines. 2. b) Is this SPC chart ok to use to monitor and control the process? 3. c) After this first week, is the process still running ok? 4. d) How would you apply the quality improvement procedure to investigate and improve this process? Provide arguments and justification for your suggested approach. 0125P Assume you are working as a quality manager responsible for a number of manufacturing processes in a factory. You have been given the task of reviewing a statistical controlled quality system implemented. After looking into the operations of a machine a handful of operators are sure that the machine is running in a desired way and have then set up the chart. They have set up a SPC based on the sample system in tab 1 below (with 7 units in each sample, and sampled 10 times). Towards the end of the first week you are able to draw 2 new rounds of samples, each of them of seven products to send to a lab for quality inspections. The week after you receive the following result back (tab 2. below). Sample/ Product # weight #1 #2 #3 #4 #5 #6 #7 1 24 36 27 30 33 34 37 2 27 35 28 28 33 33 34 3 28 28 28 27 28 37 34 4 33 24 29 26 27 22 35 5 29 27 27 27 30 30 29 6 30 32 27 26 25 31 32 7 29 33 28 23 34 28 35 8 31 36 28 22 33 29 33 9 38 31 28 27 33 30 32 10 42 28 28 30 31 31 32 Tab 1 1 2 3 4 5 5 6 7 sample round 1 38 38 38 38 38 38 37 sample round 2 41 36 27 28 33 20 25 Tab 2 1. a) Based on the data in tab 1 construct a suitable control chart with the typical 3 sigma limits which the operators have been using in the daily quality routines. 2. b) Is this SPC chart ok to use to monitor and control the process? 3. c) After this first week, is the process still running ok? 4. d) How would you apply the quality improvement procedure to investigate and improve this process? Provide arguments and justification for your suggested approachStep by Step Solution
There are 3 Steps involved in it
1 Expert Approved Answer
Step: 1 Unlock

Question Has Been Solved by an Expert!
Get step-by-step solutions from verified subject matter experts
Step: 2 Unlock
Step: 3 Unlock