

Question: Old MathJax webview please attempt this question ..I w ill appreciate QUESTION 2 Required: You have been asked by the Board of Directors to carry
Old MathJax webview
please attempt this question ..I w ill appreciate
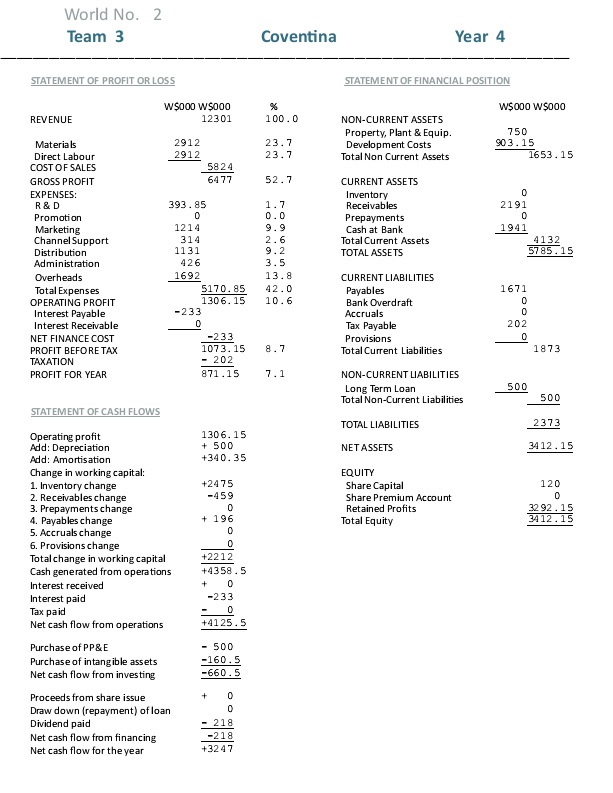
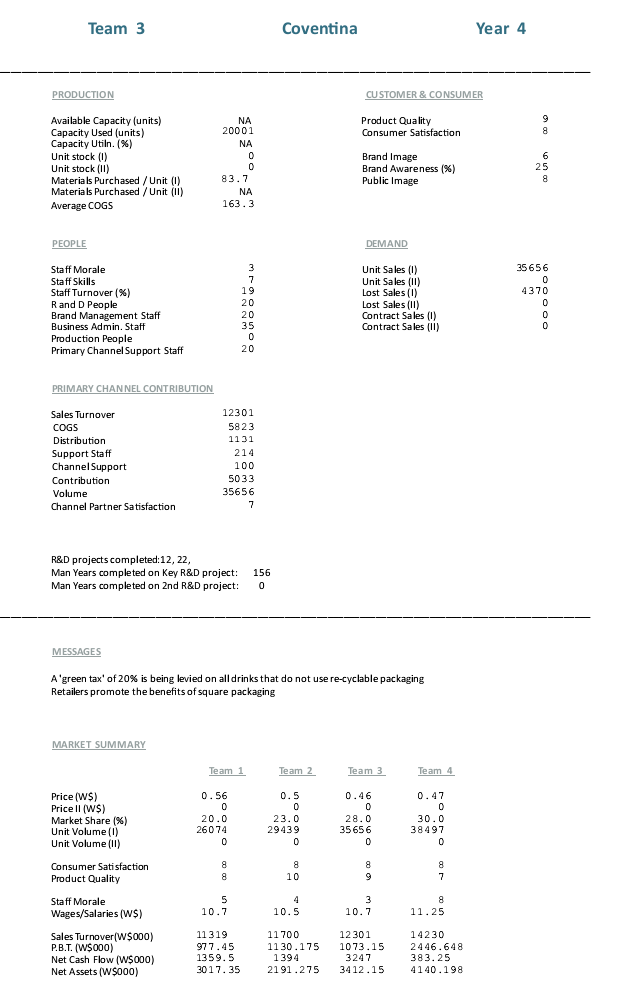
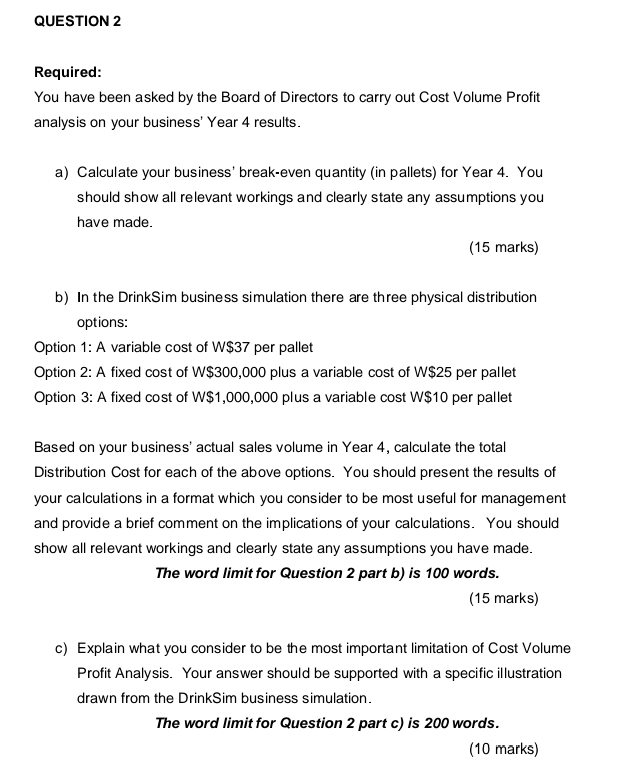
QUESTION 2 Required: You have been asked by the Board of Directors to carry out Cost Volume Profit analysis on your business' Year 4 results. a) Calculate your business' break-even quantity (in pallets) for Year 4. You should show all relevant workings and clearly state any assumptions you have made. (15 marks) b) In the DrinkSim business simulation there are three physical distribution options: Option 1: A variable cost of W$37 per pallet Option 2: A fixed cost of W$300,000 plus a variable cost of W$25 per pallet Option 3: A fixed cost of W$1,000,000 plus a variable cost W$10 per pallet Based on your business' actual sales volume in Year 4, calculate the total Distribution Cost for each of the above options. You should present the results of your calculations in a format which you consider to be most useful for management and provide a brief comment on the implications of your calculations. You should show all relevant workings and clearly state any assumptions you have made. The word limit for Question 2 part b) is 100 words. (15 marks) c) Explain what you consider to be the most important limitation of Cost Volume Profit Analysis. Your answer should be supported with a specific illustration drawn from the DrinkSim business simulation. The word limit for Question 2 part c) is 200 words. (10 marks) World No. 2 Team 3 Coventina Year 4 STATEMENT OF PROFIT OR LOSS STATEMENT OF FINANCIAL POSITION W$000 w$000 W$000 W$000 12301 REVENUE 100.0 2912 2912 23.7 23.7 NON-CURRENT ASSETS Property, Plant & Equip. Development Costs Total Non Current Assets 750 903.15 1653.15 5824 6477 52.7 CURRENT ASSETS Inventory Receivables Prepayments Cash at Bank Total Current Assets TOTAL ASSETS Materials Direct Labour COST OF SALES GROSS PROFIT EXPENSES: R&D Promotion Marketing Channel Support Distribution Administration Overheads Total Expenses OPERATING PROFIT Interest Payable Interest Receivable NET FINANCE COST PROFIT BEFORE TAX TAXATION PROFIT FOR YEAR 0 2191 0 1941 4132 5785.15 1.7 0.0 9.9 2.6 9.2 3.5 13.8 42.0 10.6 393.85 0 1214 314 1131 426 1692 5170.85 1306.15 -233 0 -233 1073.15 - 202 871.15 CURRENT LIABILITIES Payables Bank Overdraft Accruals Tax Payable Provisions Total Current Liabilities 1671 0 0 202 0 8.7 1873 7.1 NON-CURRENT LIABILITIES Long Term Loan Total Non-Current Liabilities 500 500 STATEMENT OF CASH FLOWS 2373 1306.15 + 500 +340.35 34 12.15 TOTAL LIABILITIES NET ASSETS EQUITY Share Capital Share Premium Account Retained Profits Total Equity 120 0 32 92.15 34 12.15 Operating profit Add: Depreciation Add: Amortisation Change in working capital: 1. Inventory change 2. Receivables change 3. Prepayments change 4. Payables change 5. Accruals change 6. Provisions change Totalchange in working capital Cash generated from operations Interest received Interest paid Tax paid Net cash flow from operations Purchase of PP&E Purchase of intangible assets Net cash flow from investing Proceeds from share issue Draw down (repayment) of loan Dividend paid Net cash flow from financing Net cash flow for the year +2475 -459 0 + 196 0 0 +2212 +4358.5 + 0 -233 0 +41 25.5 - 500 -160.5 -660.5 + 0 0 - 218 -218 +3247 Team 3 Coventina Year 4 PRODUCTION CUSTOMER & CONSUMER Product Quality Consumer Satisfaction 9 8 Available Capacity (units) Capacity Used (units) Capacity Utiln. (%) Unit stock (0) 0) Unit stock (11) Materials Purchased / Unit (1) Materials Purchased / Unit (1) Average COGS NA 20001 NA 0 0 83.7 NA 163.3 Brand Image Brand Awareness % Public Image 6 6 25 8 PEOPLE DEMAND Staff Morale Staff Skills Staff Turnover (%) Rand D People Brand Management Staff Business Admin. Staff Production People Primary Channel Support Staff 3 7 19 20 20 35 0 20 Unit Sales (0) Unit Sales (1) Lost Sales (0) Lost Sales (II) () Contract Sales (0) Contract Sales (11) 35 656 0 4370 0 0 0 PRIMARY CHANNEL CONTRIBUTION Sales Turnover COGS Distribution Support Staff Channel Support Contribution Volume Channel Partner Satisfaction 12301 5823 1131 214 100 5033 35656 7 R&D projects completed:12, 22 Man Years completed on Key R&D project: Man Years completed on 2nd R&D project: 156 0 MESSAGES A'green tax' of 20% is being levied on all drinks that do not use re-cyclable packaging Retailers promote the benefits of square packaging MARKET SUMMARY Team 1 Team 2 Team 3 Team 4 0.5 Price (WS) Price II (WS) Market Share (%) Unit Volume (0) Unit Volume (1) 0.56 0 20.0 26074 0 23.0 29439 0 0.46 0 0 28.0 35656 0 0.47 0 0 30.0 38497 0 Consumer Satisfaction Product Quality 8 8 8 10 8 9 8 7 Staff Morale Wages/Salaries (WS) 5 10.7 4 10.5 3 3 10.7 8 8 11.25 Sales Turnover(5000) P.B.T. (W$ 000) Net Cash Flow (W$000) Net Assets (W$000) 11319 977.45 1359.5 3017.35 11700 1130.175 1394 2191.275 12 301 1073.15 3247 3412.15 14230 2446.648 383.25 4140.198
Step by Step Solution
There are 3 Steps involved in it

Get step-by-step solutions from verified subject matter experts