

Question: Old MathJax webview please Help Visualization of data is a powerful method to see trends and make decisions. Microsoft Excel trending capabilities are tools to
Old MathJax webview
please Help
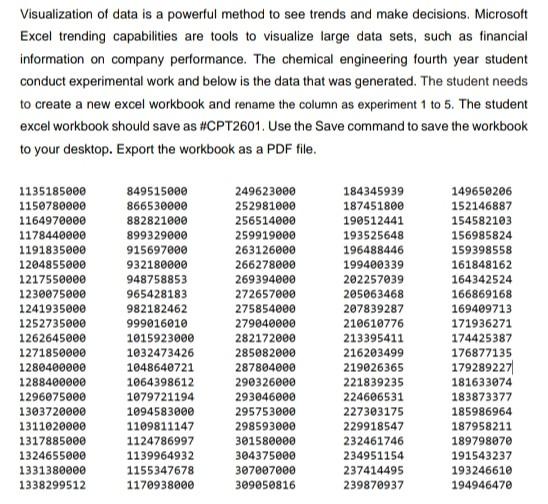
Visualization of data is a powerful method to see trends and make decisions. Microsoft Excel trending capabilities are tools to visualize large data sets, such as financial information on company performance. The chemical engineering fourth year student conduct experimental work and below is the data that was generated. The student needs to create a new excel workbook and rename the column as experiment 1 to 5. The student excel workbook should save as #CPT2601. Use the Save command to save the workbook to your desktop. Export the workbook as a PDF file. 1135185000 1150780000 1164970000 1178440000 1191835000 1204855000 1217550000 1230075000 1241935000 1252735000 1262645000 1271850000 1280400000 1288400000 1296075000 1303720000 1311020000 1317885000 1324655000 1331380000 1338299512 849515000 866530000 882821000 899329000 915697000 932180000 948758853 965428183 982182462 999016010 1015923000 1032473426 1048640721 1064398612 1079721194 1094583000 1109811147 1124786997 1139964932 1155347678 1170938000 249623000 252981000 256514000 259919000 263126000 266278000 269394000 272657000 275854000 279040000 282172000 285082000 287804000 290326000 293046000 295753000 298593000 301580000 304375000 307807000 309050816 184345939 187451800 190512441 193525648 196488446 199400339 202257039 205063468 207839287 210610776 213395411 216203499 219026365 221839235 224606531 227303175 229918547 232461746 234951154 237414495 239870937 149650206 152146887 154582103 156985824 159398558 161848162 164342524 166869168 169409713 171936271 174425387 176877135 179289227 181633074 183873377 185986964 187958211 189798070 191543237 193246610 194946470 Visualization of data is a powerful method to see trends and make decisions. Microsoft Excel trending capabilities are tools to visualize large data sets, such as financial information on company performance. The chemical engineering fourth year student conduct experimental work and below is the data that was generated. The student needs to create a new excel workbook and rename the column as experiment 1 to 5. The student excel workbook should save as #CPT2601. Use the Save command to save the workbook to your desktop. Export the workbook as a PDF file. 1135185000 1150780000 1164970000 1178440000 1191835000 1204855000 1217550000 1230075000 1241935000 1252735000 1262645000 1271850000 1280400000 1288400000 1296075000 1303720000 1311020000 1317885000 1324655000 1331380000 1338299512 849515000 866530000 882821000 899329000 915697000 932180000 948758853 965428183 982182462 999016010 1015923000 1032473426 1048640721 1064398612 1079721194 1094583000 1109811147 1124786997 1139964932 1155347678 1170938000 249623000 252981000 256514000 259919000 263126000 266278000 269394000 272657000 275854000 279040000 282172000 285082000 287804000 290326000 293046000 295753000 298593000 301580000 304375000 307807000 309050816 184345939 187451800 190512441 193525648 196488446 199400339 202257039 205063468 207839287 210610776 213395411 216203499 219026365 221839235 224606531 227303175 229918547 232461746 234951154 237414495 239870937 149650206 152146887 154582103 156985824 159398558 161848162 164342524 166869168 169409713 171936271 174425387 176877135 179289227 181633074 183873377 185986964 187958211 189798070 191543237 193246610 194946470
Step by Step Solution
There are 3 Steps involved in it

Get step-by-step solutions from verified subject matter experts