

Question: Old MathJax webview Solve using formulas in excel. For this question answer the following using excel spreadsheet (with formulas) 1 Details: It's March 31st, and
Old MathJax webview
Solve using formulas in excel.
For this question answer the following using excel spreadsheet (with formulas)
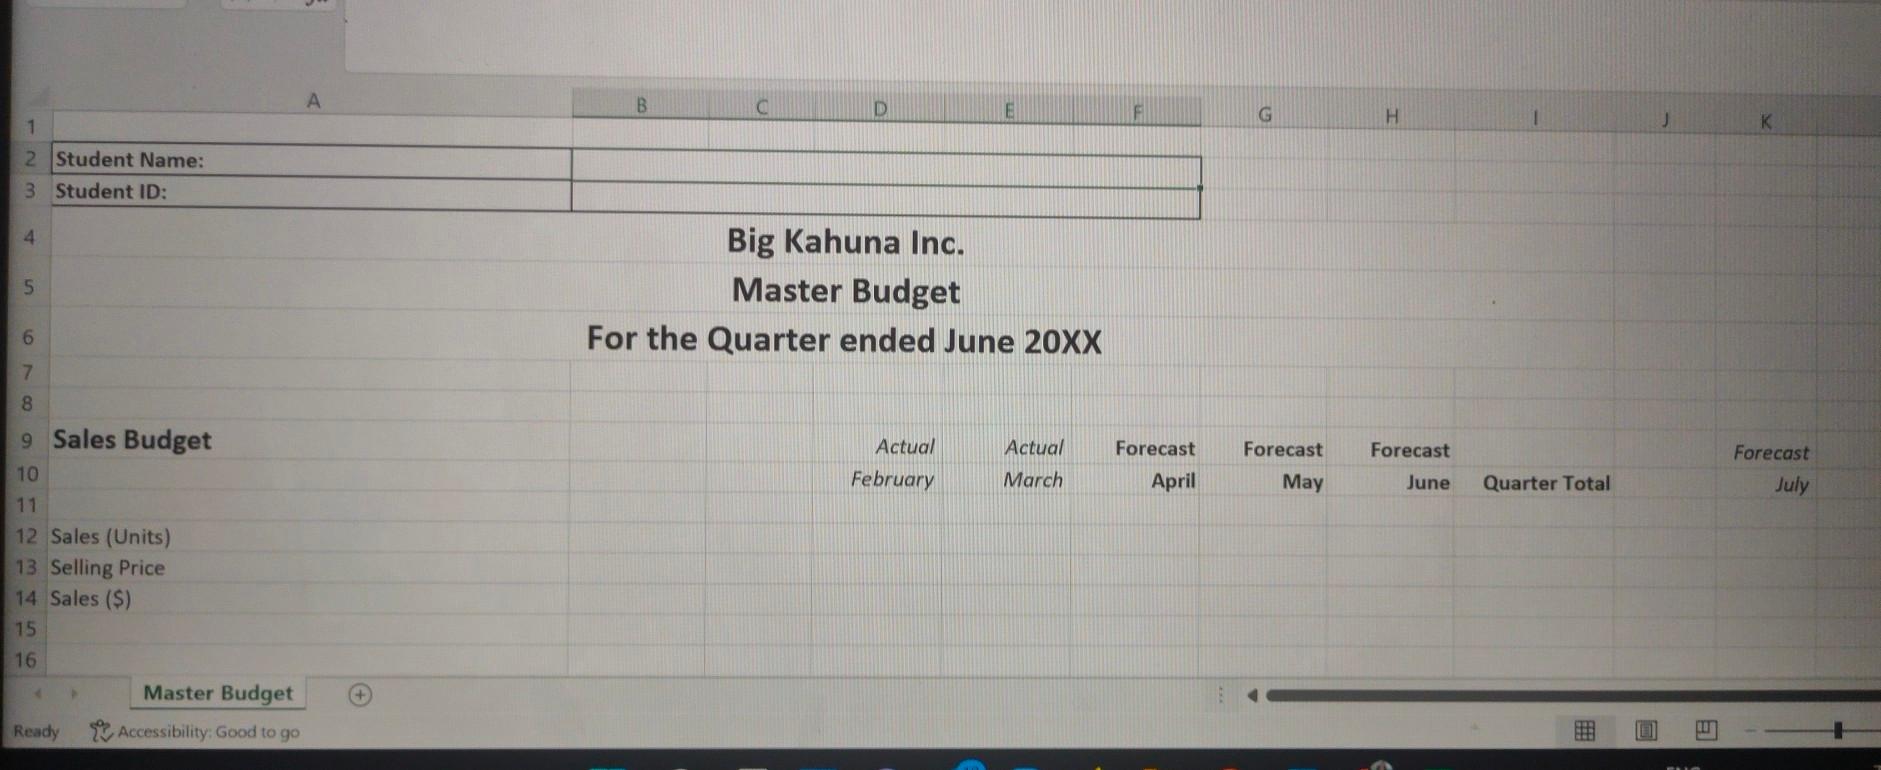
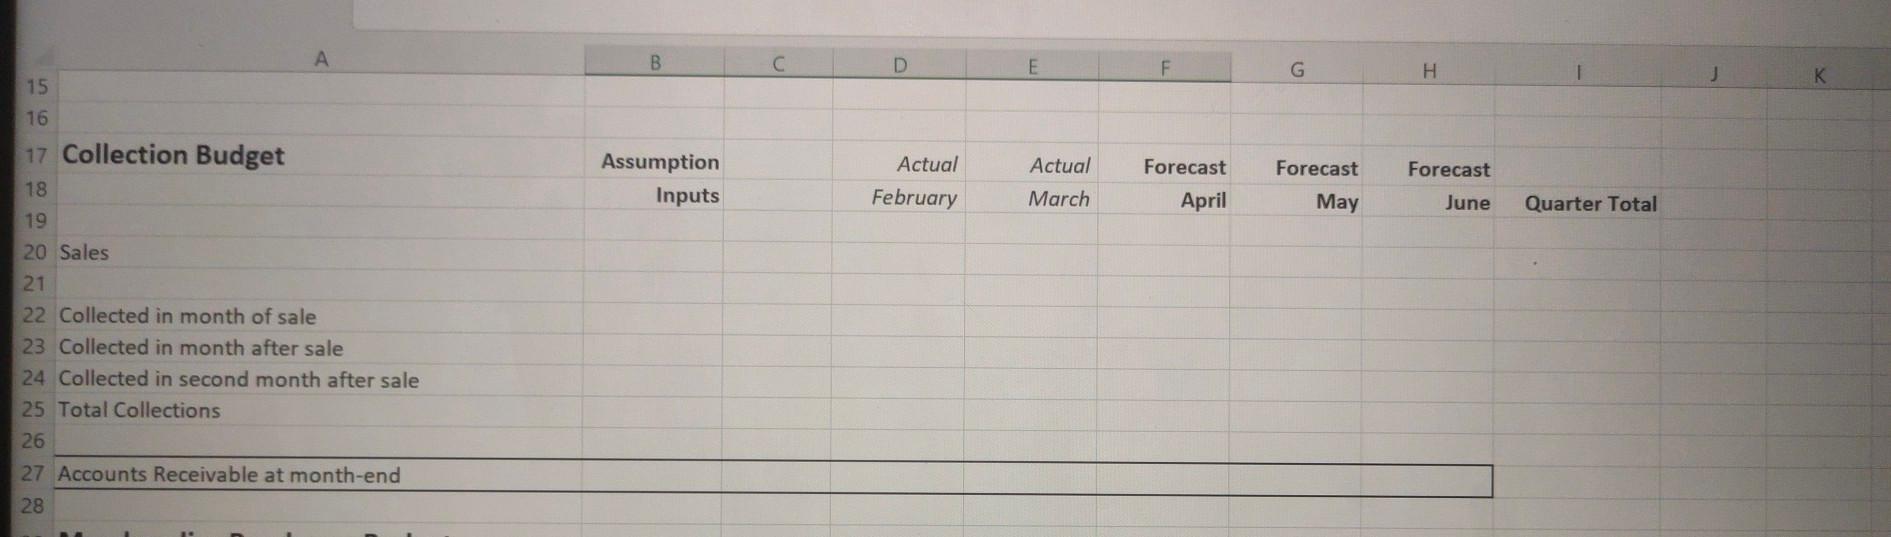
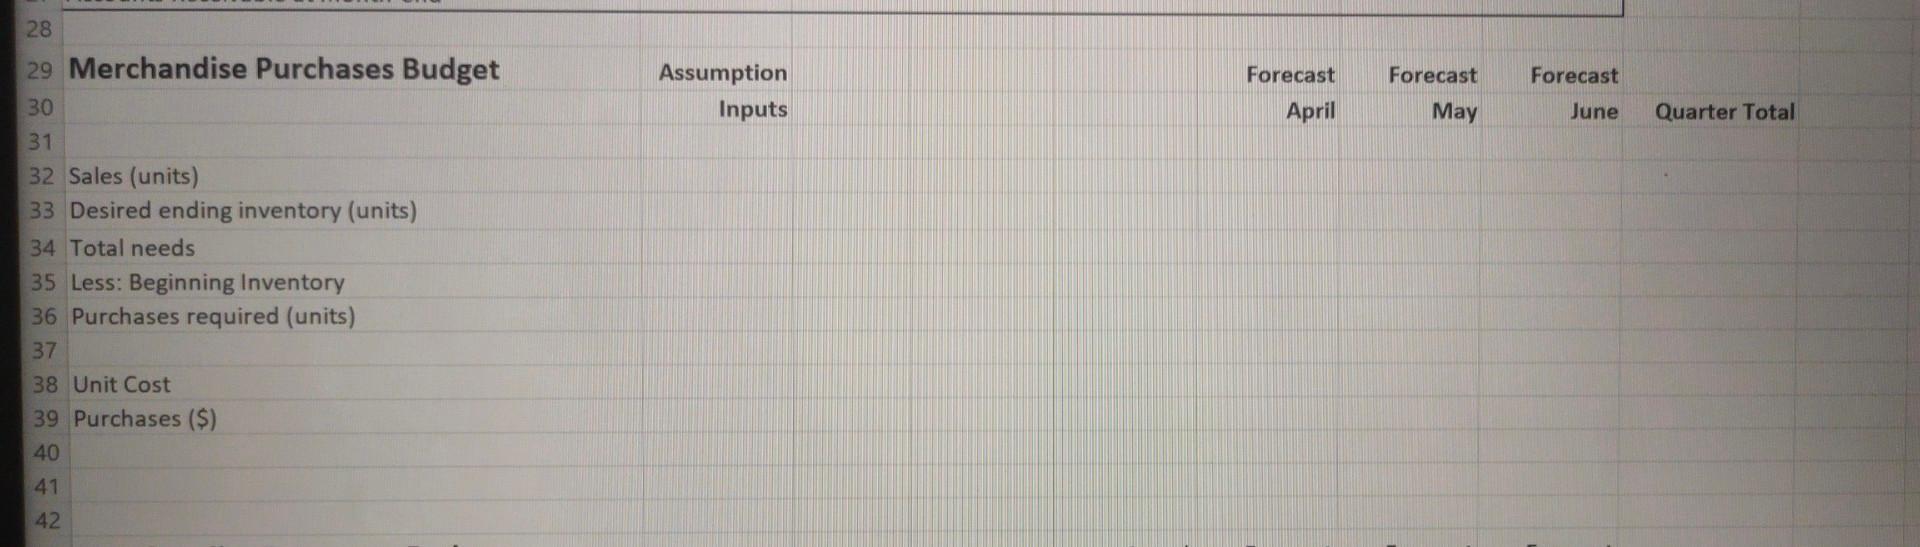
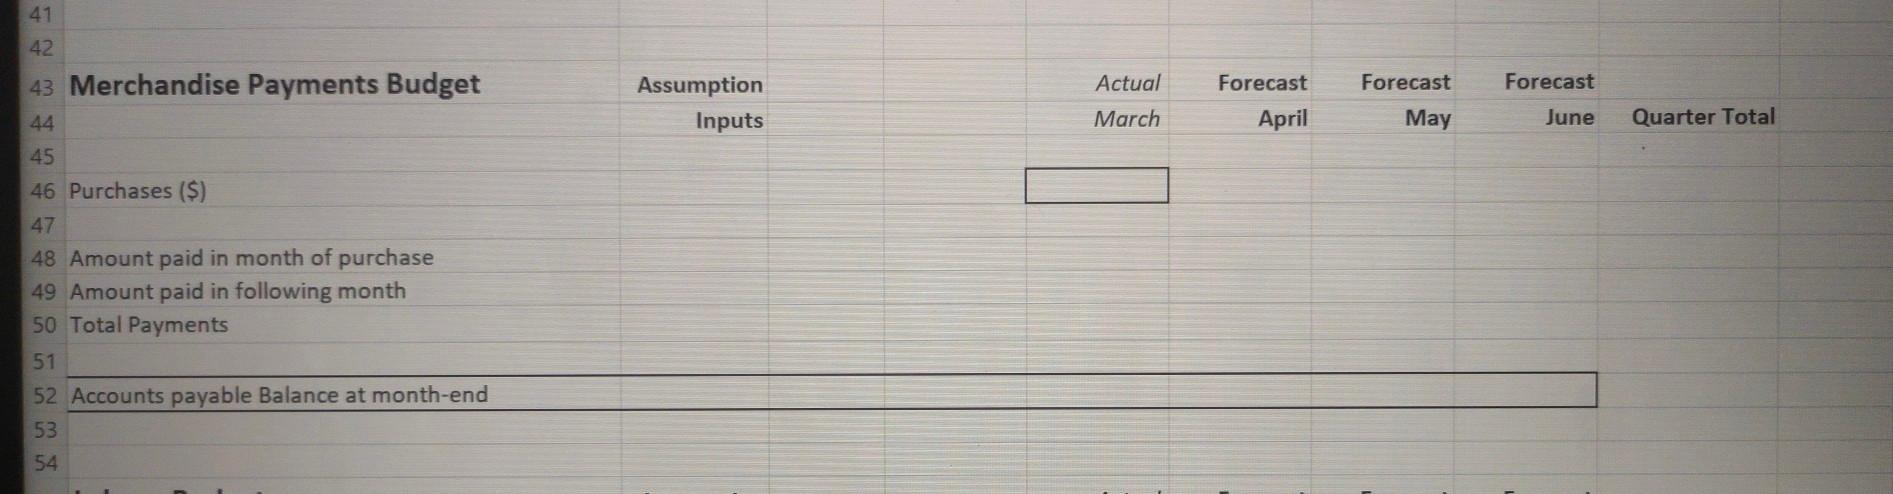
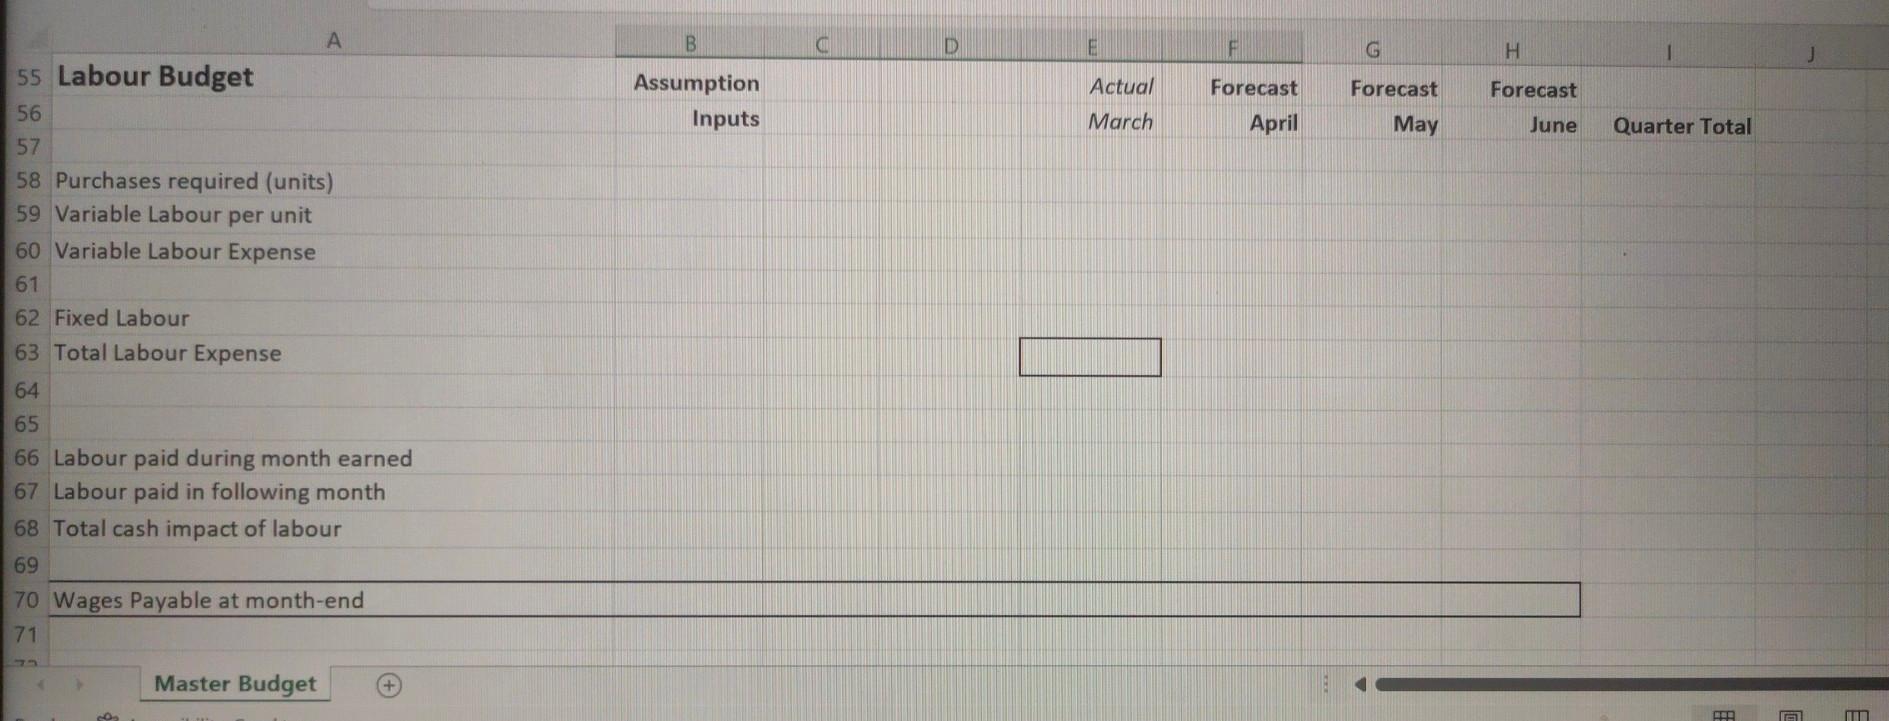
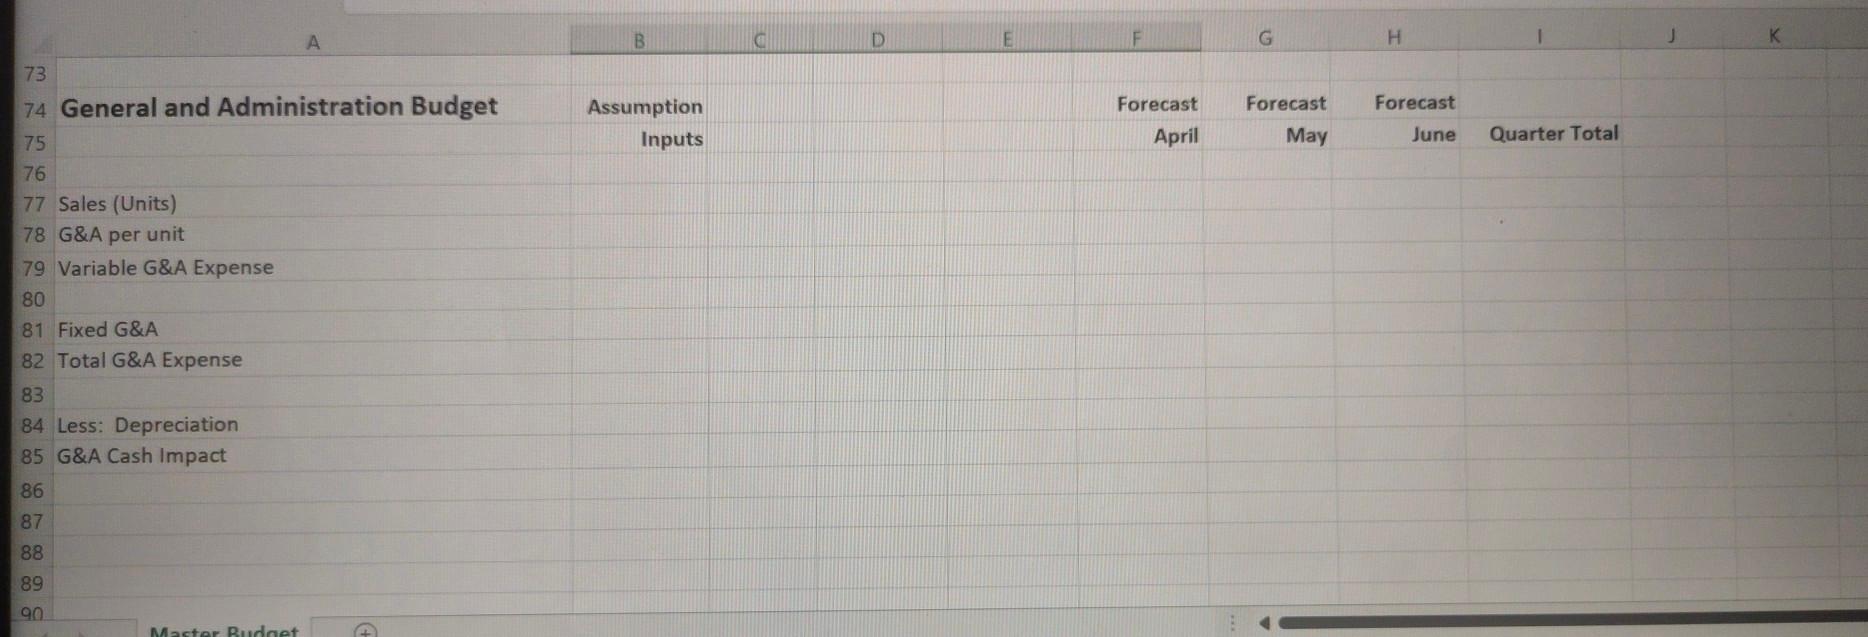
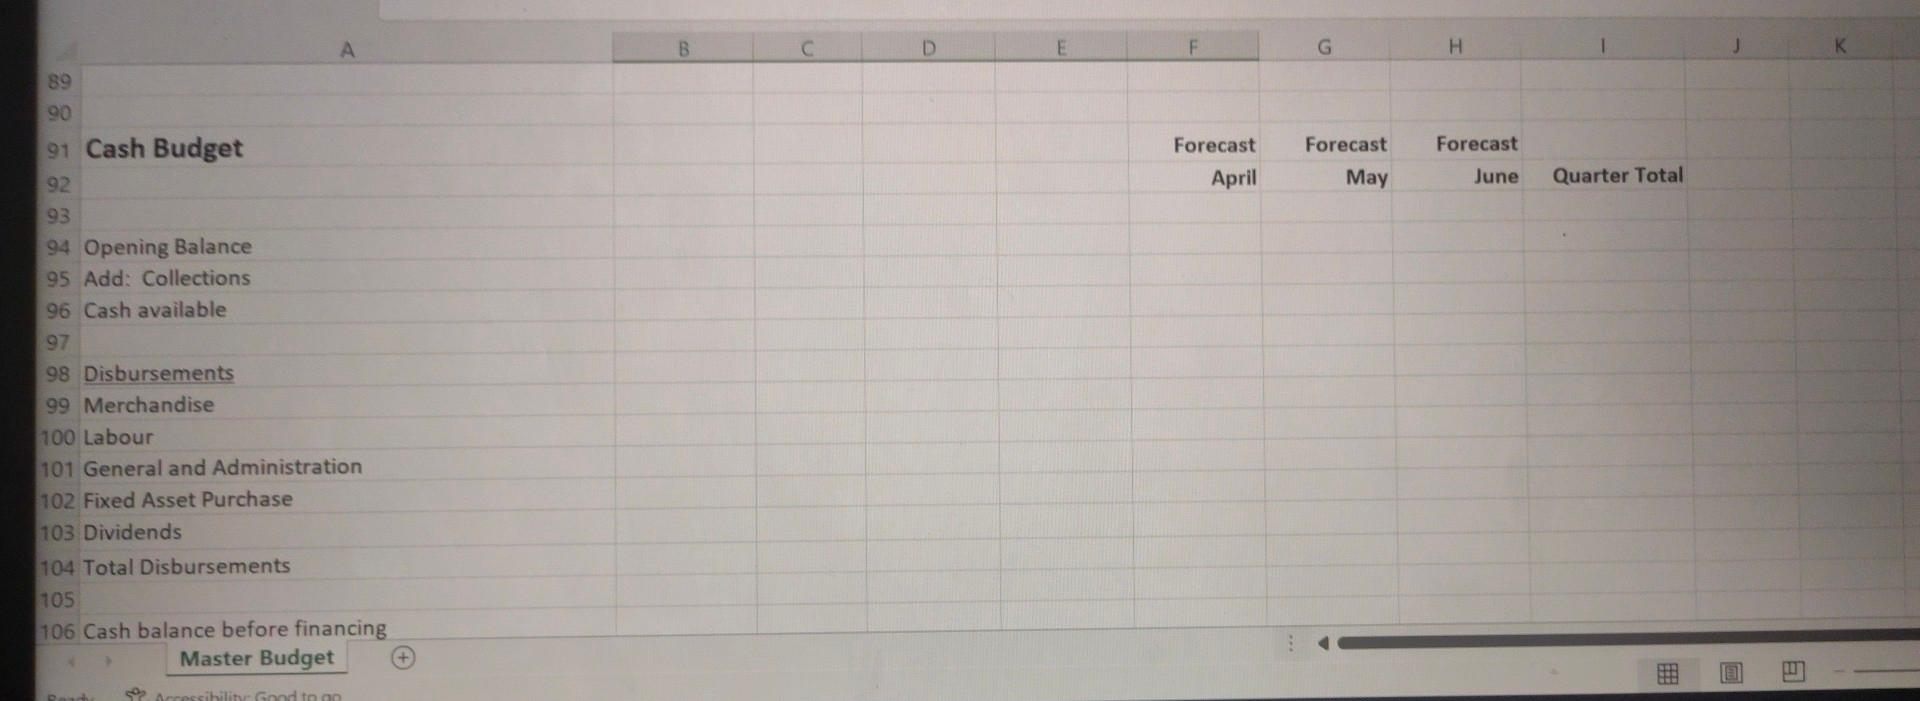
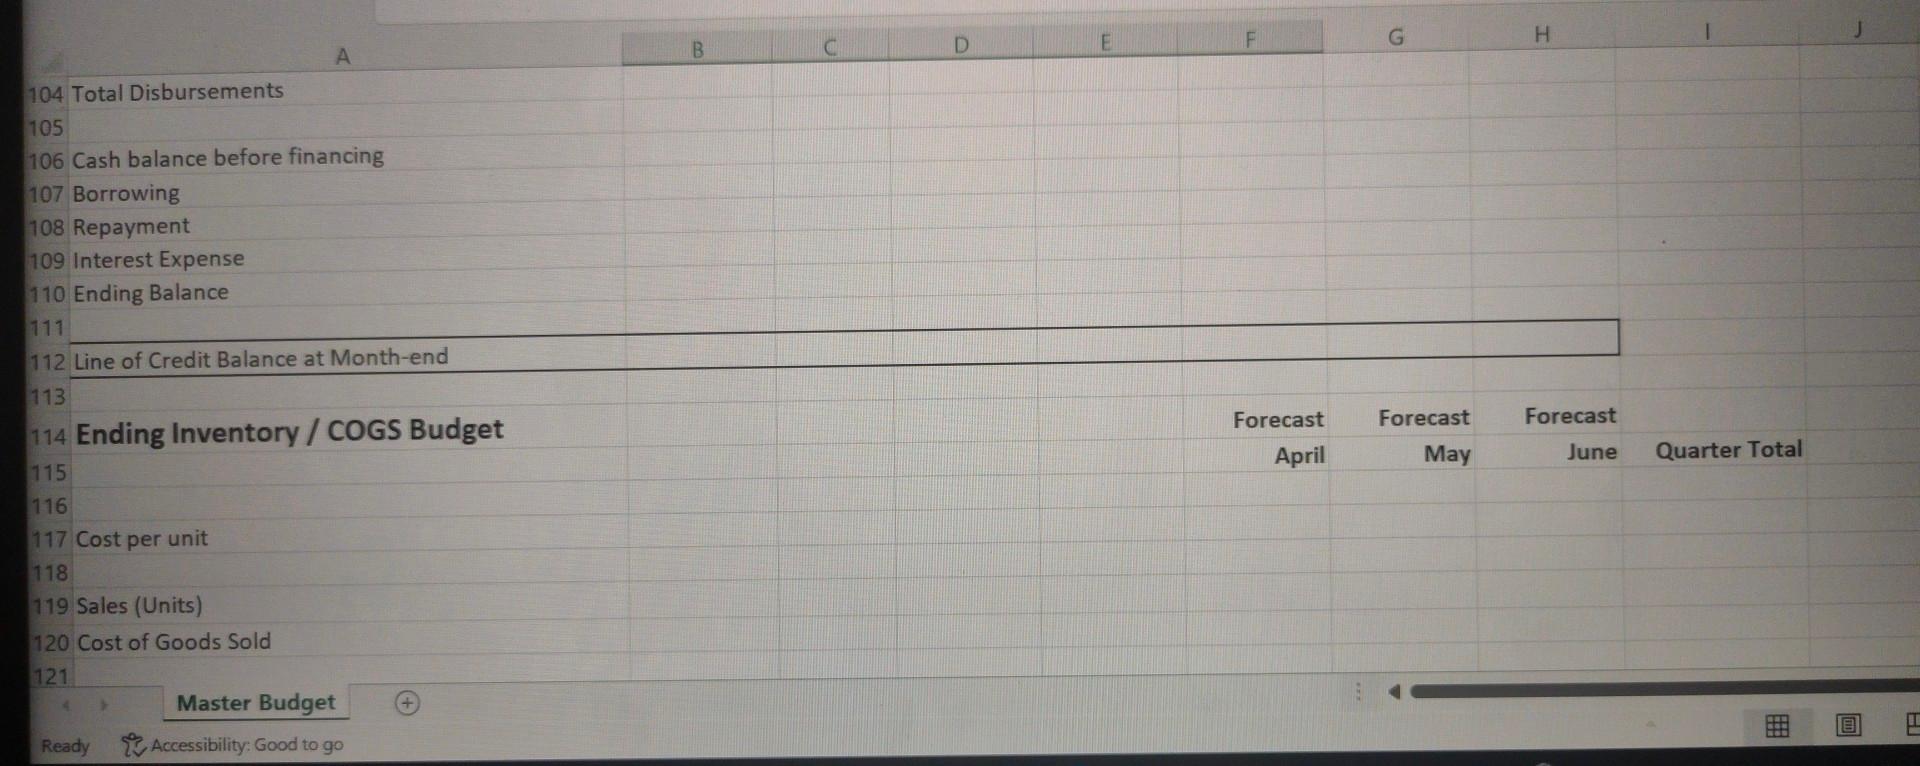
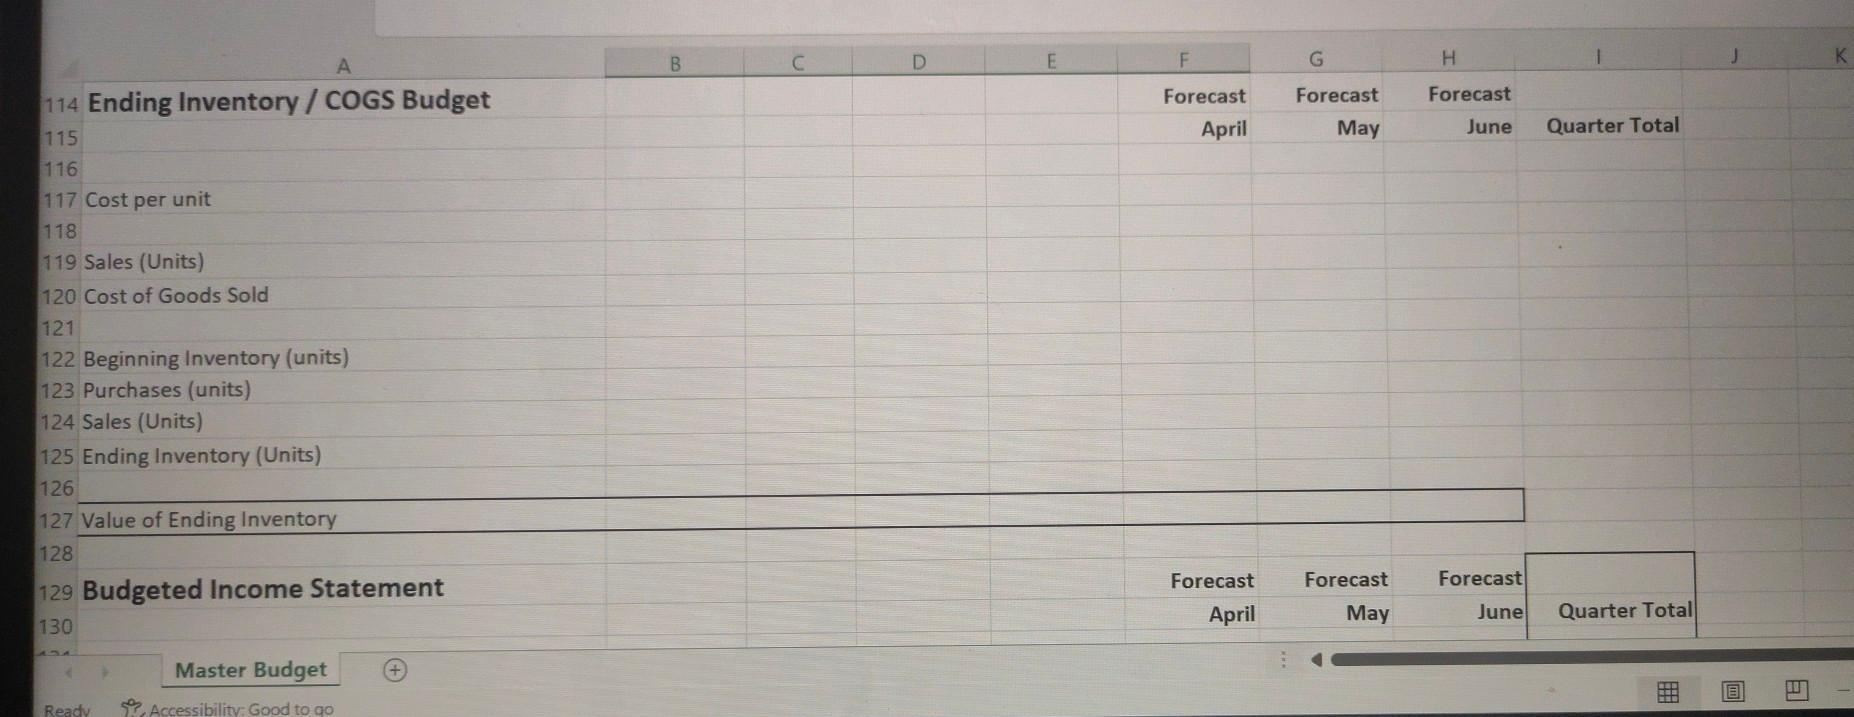
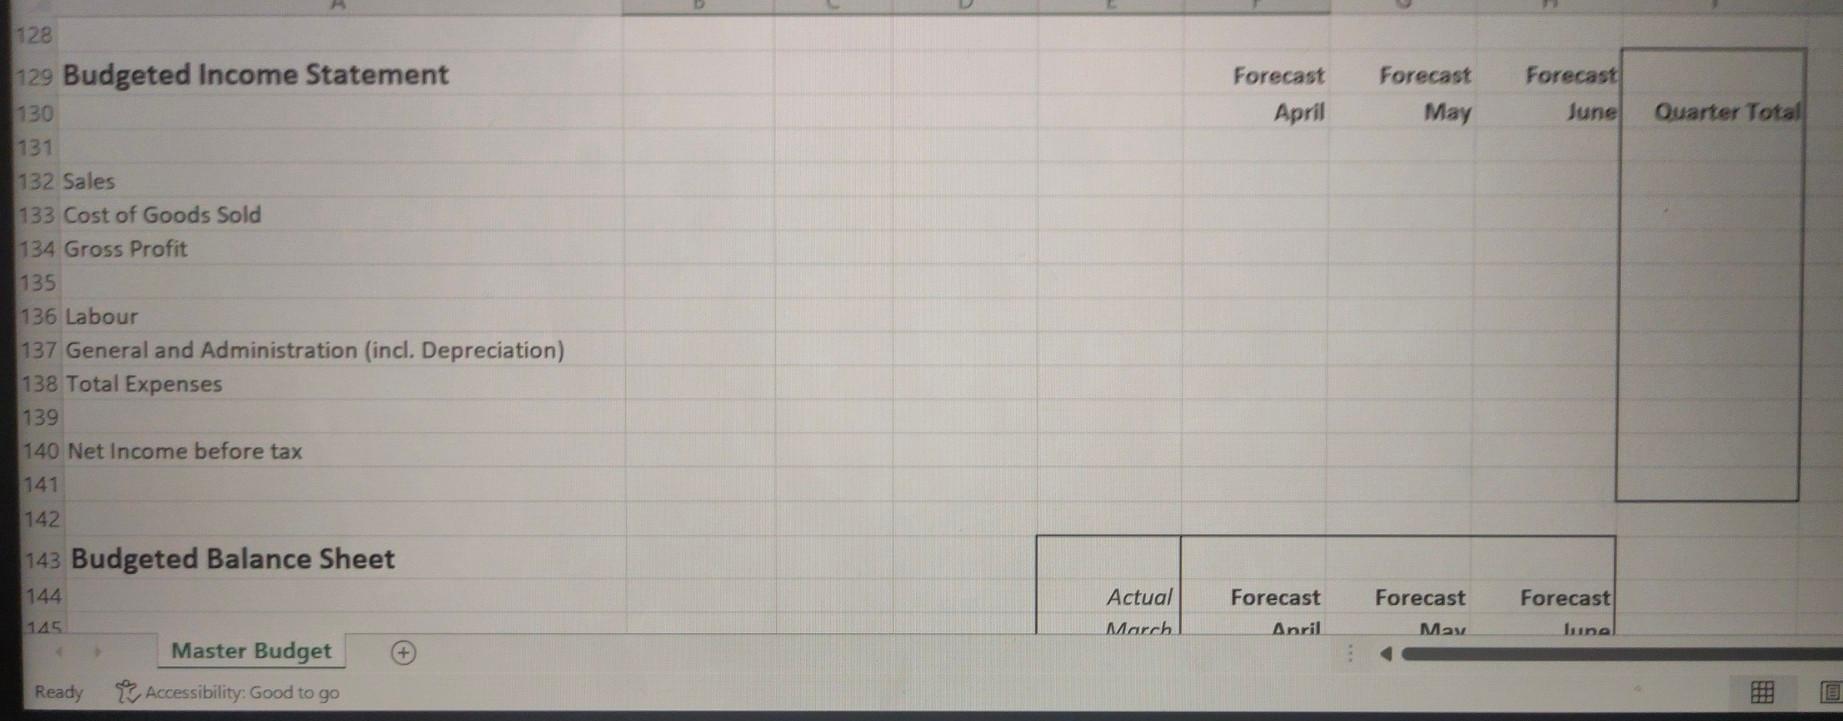
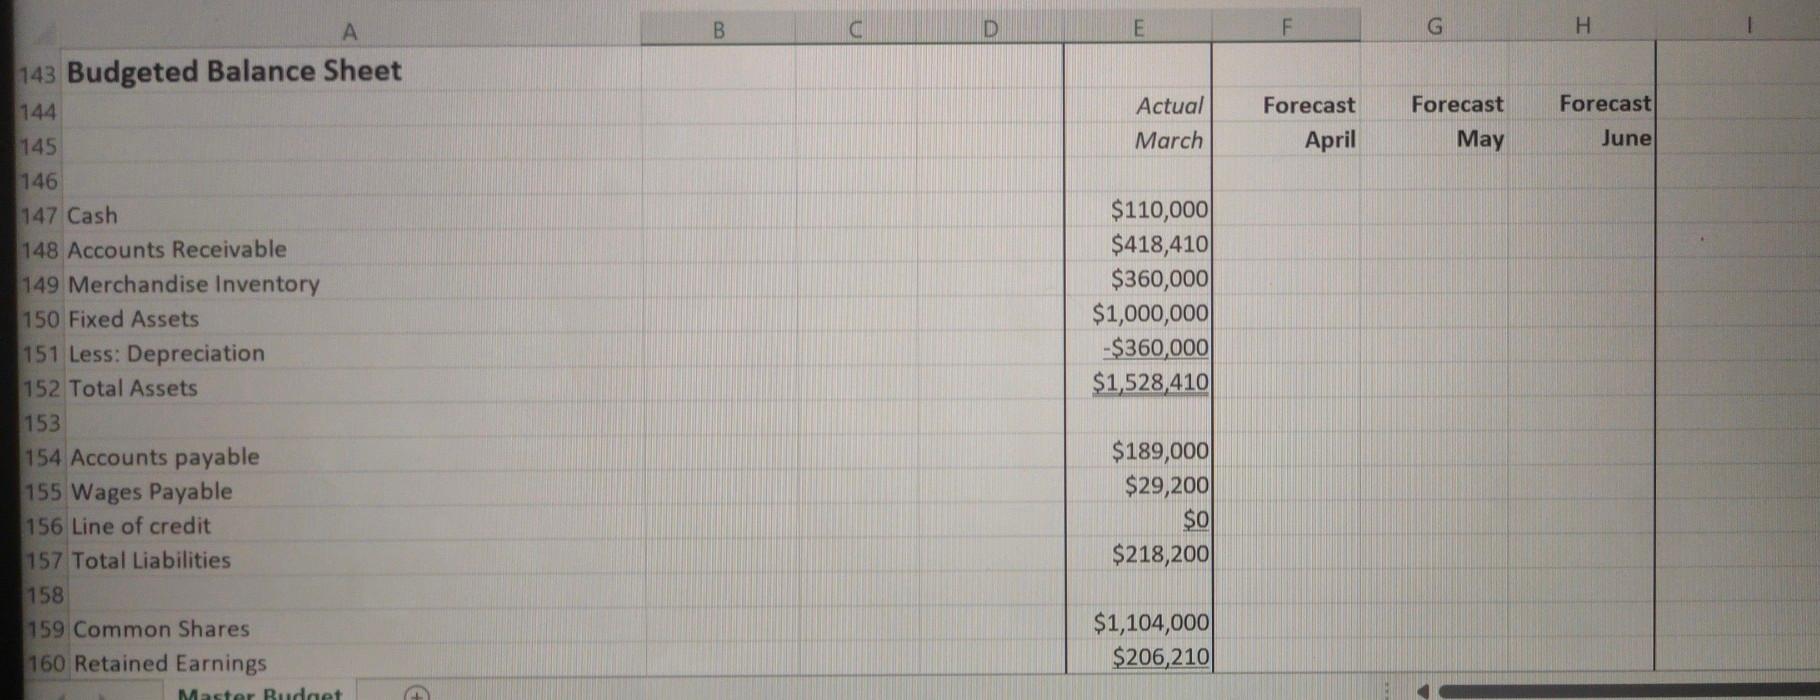
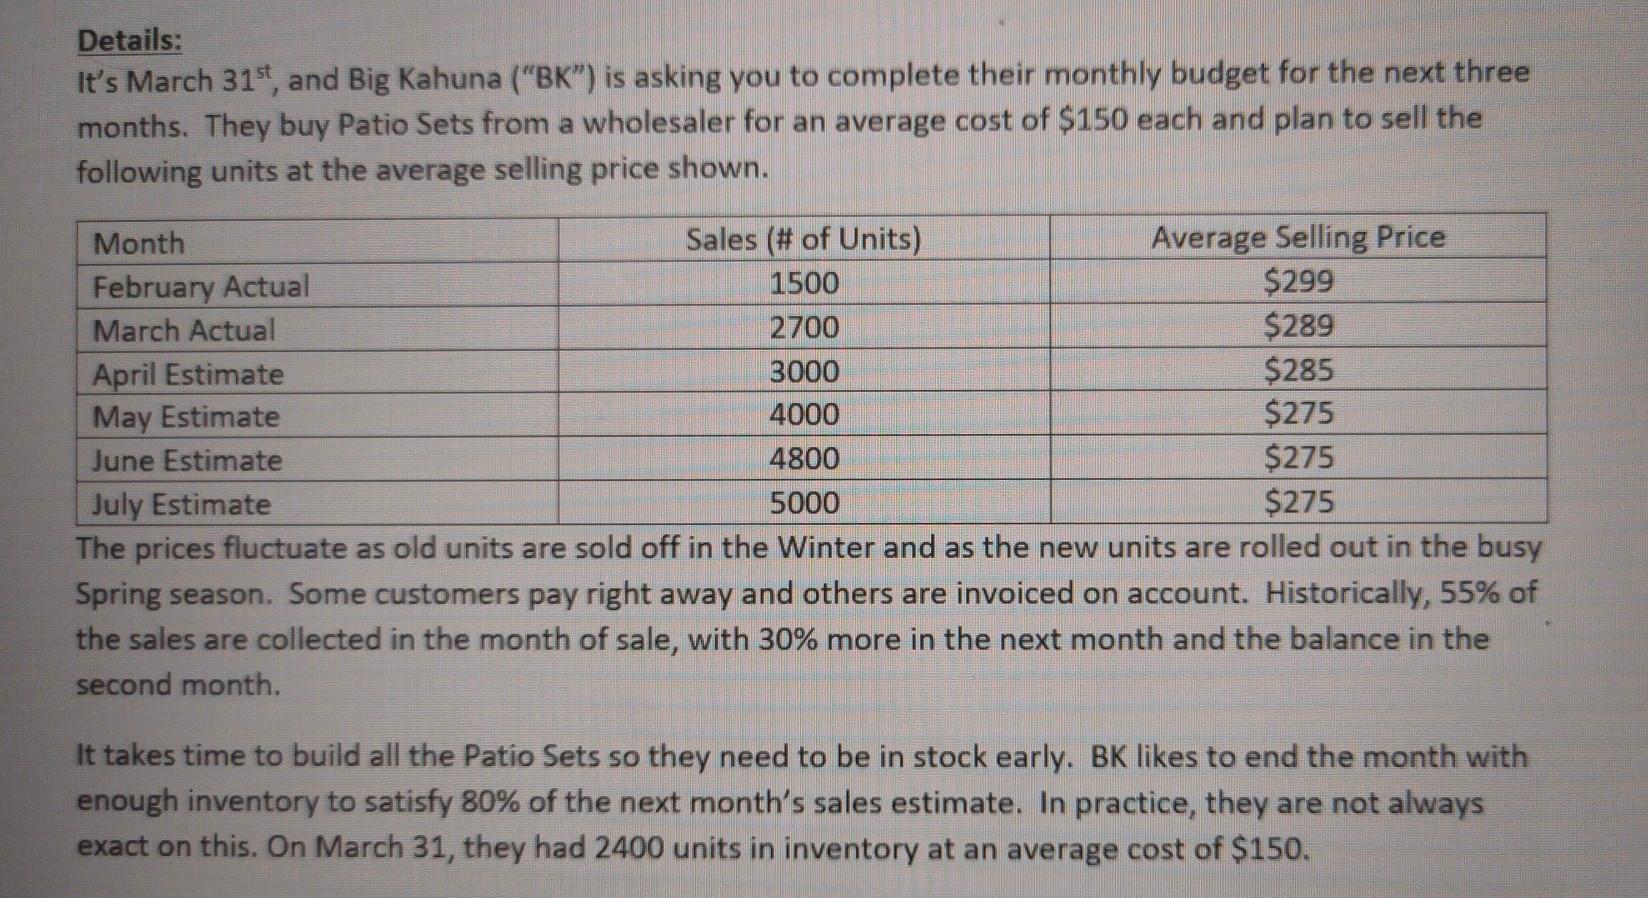
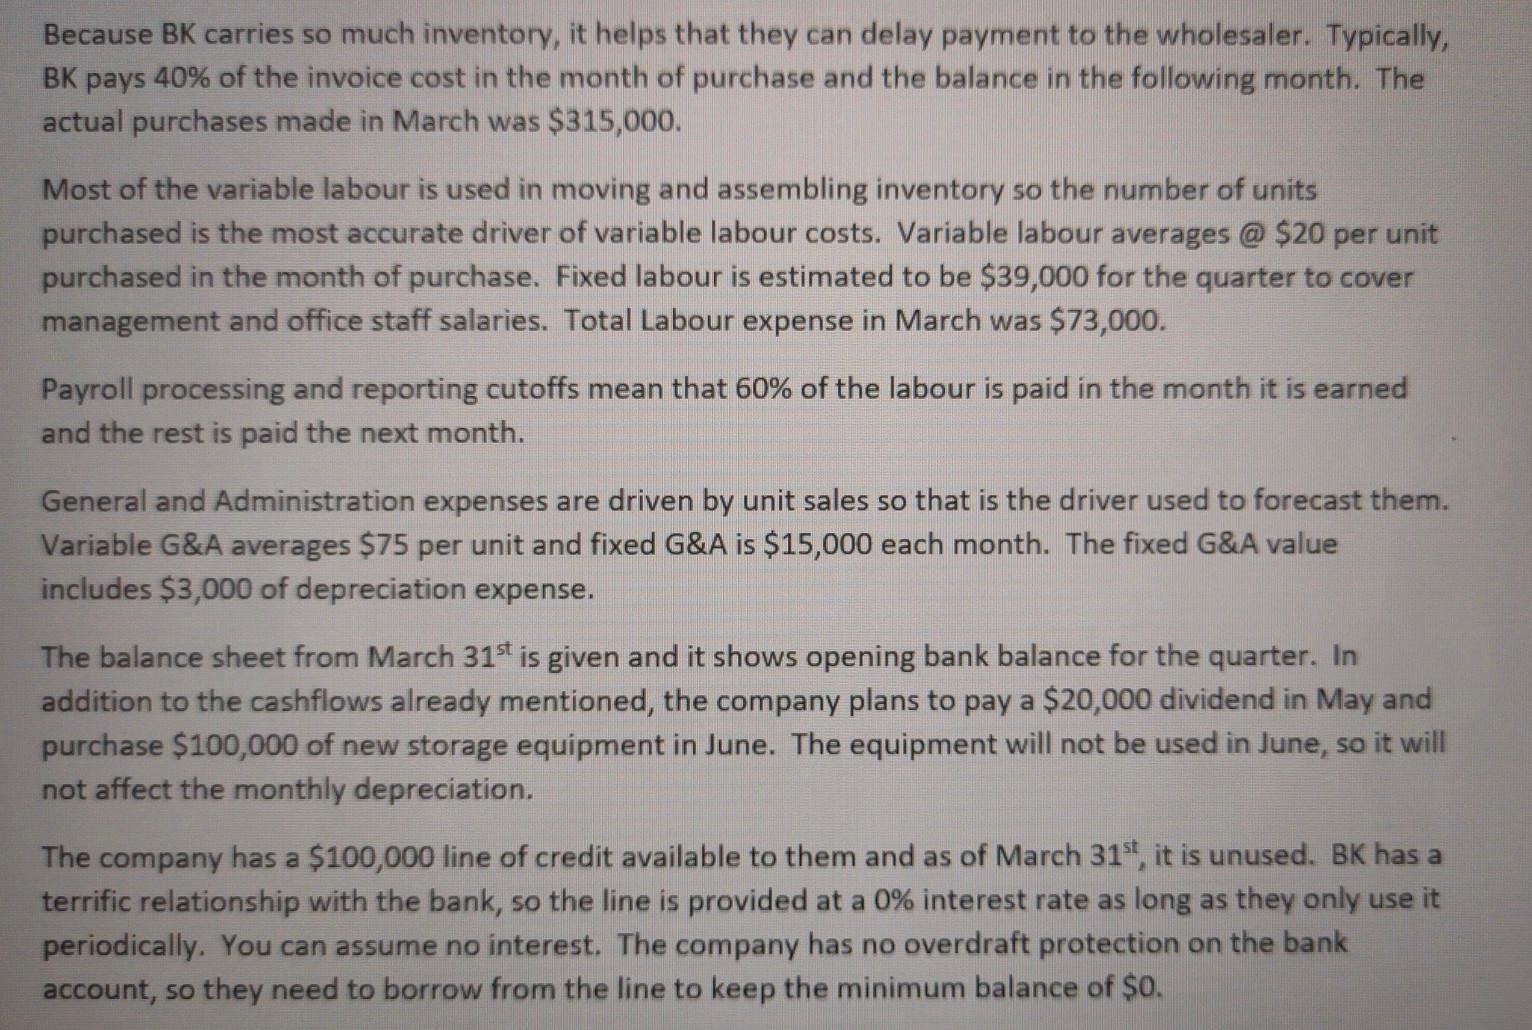
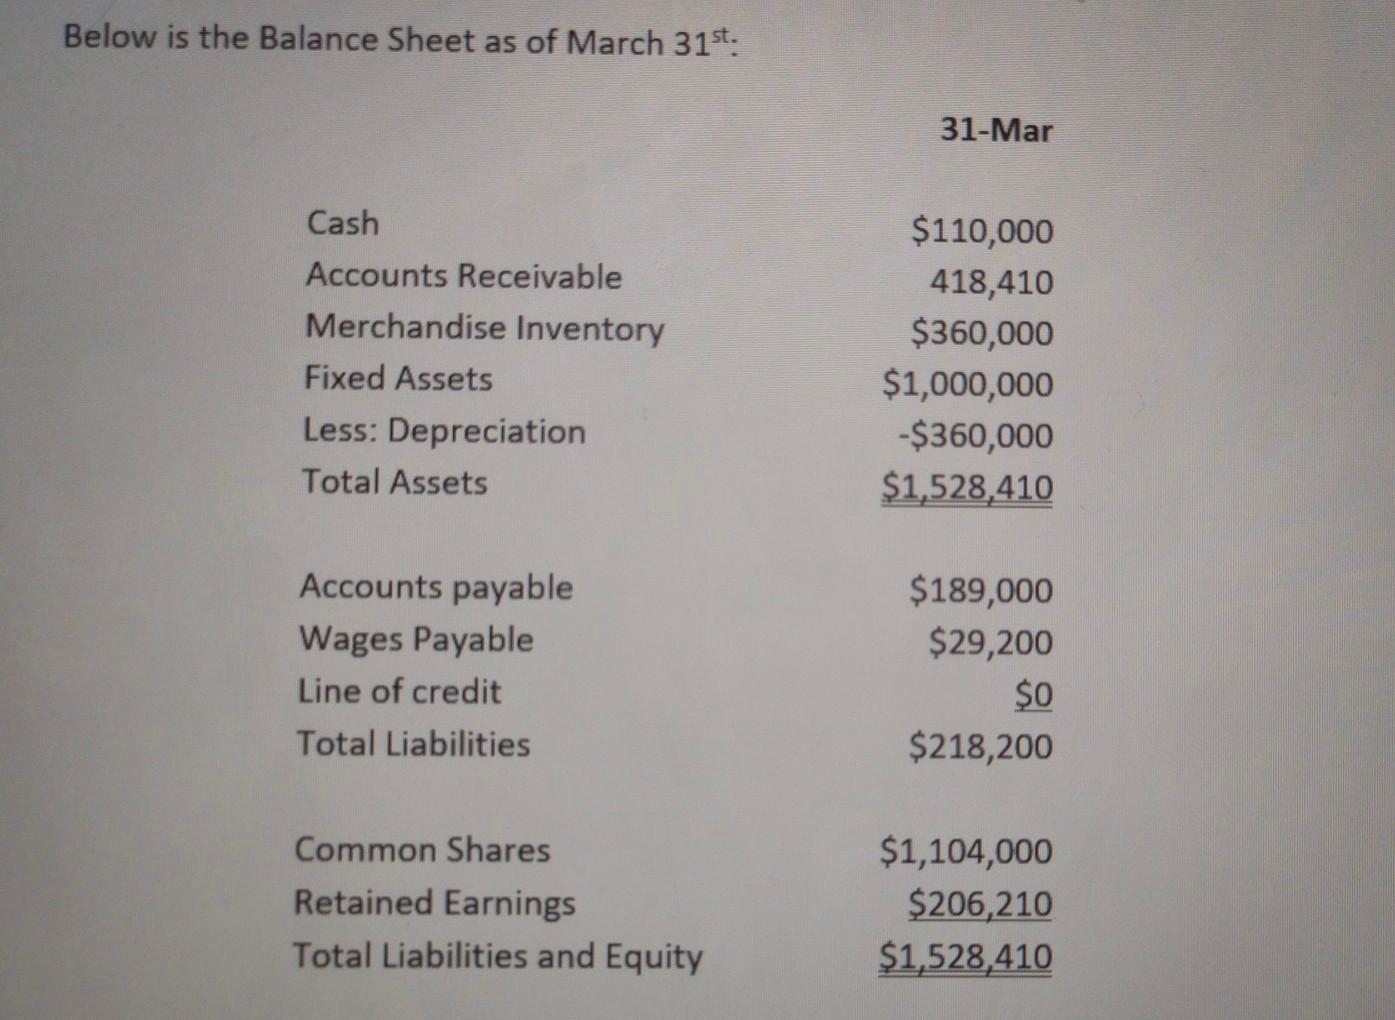
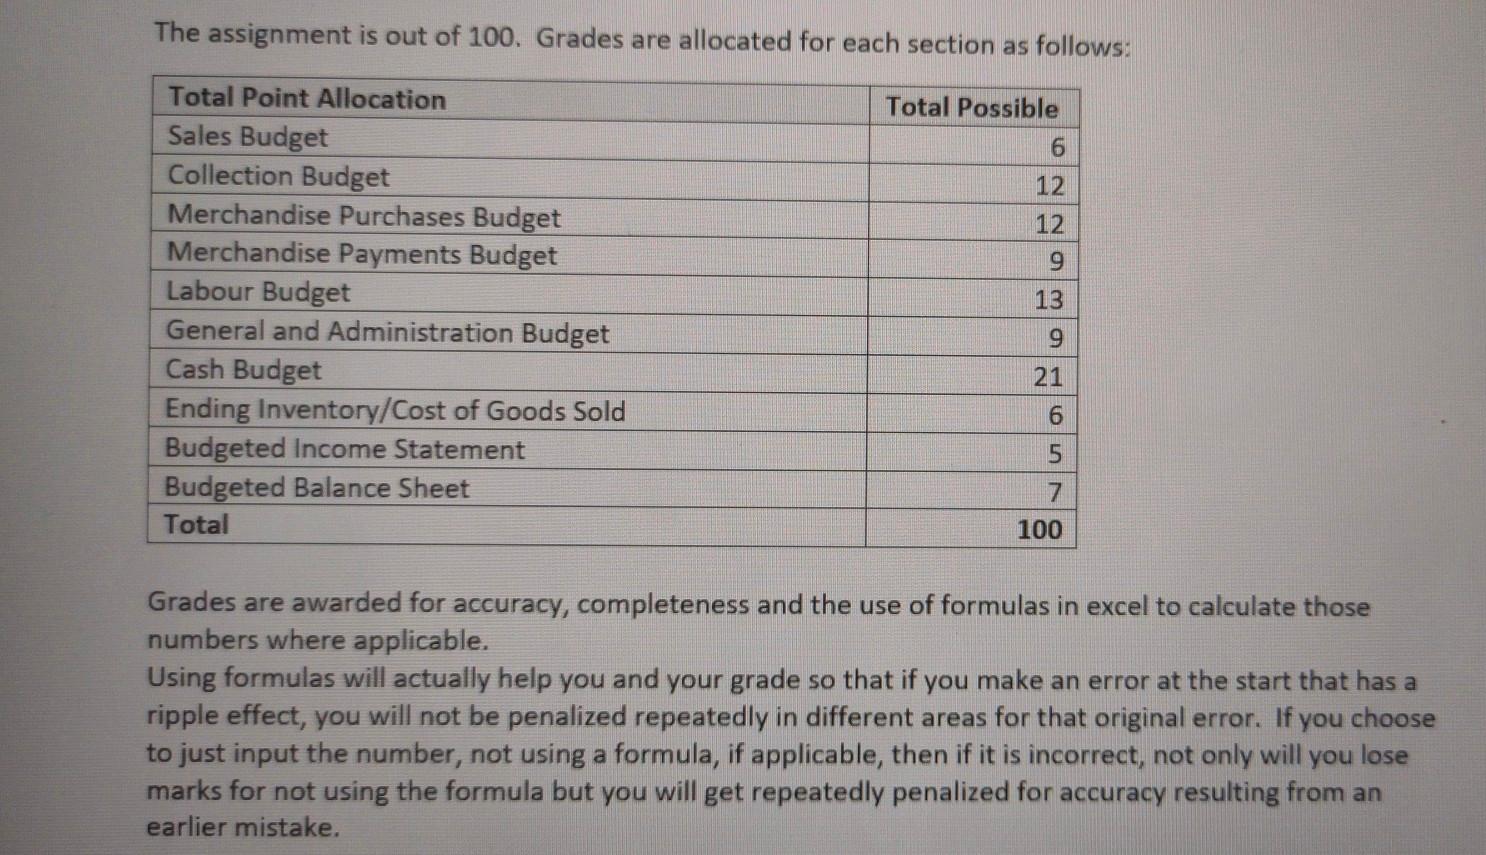
1 Details: It's March 31st, and Big Kahuna ("BK") is asking you to complete their monthly budget for the next three months. They buy Patio Sets from a wholesaler for an average cost of $150 each and plan to sell the following units at the average selling price shown. Month Sales (# of Units) Average Selling Price February Actual 1500 $299 March Actual 2700 $289 April Estimate 3000 $285 May Estimate 4000 $275 June Estimate 4800 $275 July Estimate 5000 $275 The prices fluctuate as old units are sold off in the Winter and as the new units are rolled out in the busy Spring season. Some customers pay right away and others are invoiced on account. Historically, 55% of the sales are collected in the month of sale, with 30% more in the next month and the balance in the second month. It takes time to build all the Patio Sets so they need to be in stock early. BK likes to end the month with enough inventory to satisfy 80% of the next month's sales estimate. In practice, they are not always exact on this. On March 31, they had 2400 units in inventory at an average cost of $150. Because BK carries so much inventory, it helps that they can delay payment to the wholesaler. Typically, BK pays 40% of the invoice cost in the month of purchase and the balance in the following month. The actual purchases made in March was $315,000. Most of the variable labour is used in moving and assembling inventory so the number of units purchased is the most accurate driver of variable labour costs. Variable labour averages @ $20 per unit purchased in the month of purchase. Fixed labour is estimated to be $39,000 for the quarter to cover management and office staff salaries. Total Labour expense in March was $73,000. Payroll processing and reporting cutoffs mean that 60% of the labour is paid in the month it is earned and the rest is paid the next month. General and Administration expenses are driven by unit sales so that is the driver used to forecast them. Variable G&A averages $75 per unit and fixed G&A is $15,000 each month. The fixed G&A value includes $3,000 of depreciation expense. The balance sheet from March 31st is given and it shows opening bank balance for the quarter. In addition to the cashflows already mentioned, the company plans to pay a $20,000 dividend in May and purchase $100,000 of new storage equipment in June. The equipment will not be used in June, so it will not affect the monthly depreciation. The company has a $100,000 line of credit available to them and as of March 31st, it is unused. BK has a terrific relationship with the bank, so the line is provided at a 0% interest rate as long as they only use it periodically. You can assume no interest. The company has no overdraft protection on the bank account, so they need to borrow from the line to keep the minimum balance of $0. Below is the Balance Sheet as of March 31st. 31-Mar Cash Accounts Receivable Merchandise Inventory Fixed Assets Less: Depreciation Total Assets $110,000 418,410 $360,000 $1,000,000 -$360,000 $1,528,410 Accounts payable Wages Payable Line of credit Total Liabilities $189,000 $29,200 $0 $218,200 Common Shares Retained Earnings Total Liabilities and Equity $1,104,000 $206,210 $1,528,410 The assignment is out of 100. Grades are allocated for each section as follows: Total Possible 6 12 12 9 Total Point Allocation Sales Budget Collection Budget Merchandise Purchases Budget Merchandise Payments Budget Labour Budget General and Administration Budget Cash Budget Ending Inventory/Cost of Goods Sold Budgeted Income Statement Budgeted Balance Sheet Total 13 9 21 6 5 7 100 Grades are awarded for accuracy, completeness and the use of formulas in excel to calculate those numbers where applicable. Using formulas will actually help you and your grade so that if you make an error at the start that has a ripple effect, you will not be penalized repeatedly in different areas for that original error. If you choose to just input the number, not using a formula, if applicable, then if it is incorrect, not only will you lose marks for not using the formula but you will get repeatedly penalized for accuracy resulting from an earlier mistake. A B D E F G H 1 1 K 2 Student Name: 3 Student ID: 4 5 Big Kahuna Inc. Master Budget For the Quarter ended June 20XX 6 7 Forecast Actual February Actual March Forecast April Forecast May Forecast July June Quarter Total 8. 9 Sales Budget 10 11 12 Sales (Units) 13 Selling Price 14 Sales ($) 15 16 Master Budget Ready Accessibility: Good to go LI B D E F G H K Actual Actual Assumption Inputs Forecast April Forecast May February Forecast June March Quarter Total 15 16 17 Collection Budget 18 19 20 Sales 21 22 Collected in month of sale 23 Collected in month after sale 24 Collected in second month after sale 25 Total Collections 26 27 Accounts Receivable at month-end 28 Forecast Forecast Forecast Assumption Inputs April May June Quarter Total 28 29 Merchandise Purchases Budget 30 31 32 Sales (units) 33 Desired ending inventory (units) 34 Total needs 35 Less: Beginning Inventory 36 Purchases required (units) 37 38 Unit Cost 39 Purchases ($) 40 41 42 41 42 43 Merchandise Payments Budget Forecast Assumption Inputs B8 Actual March Forecast April Forecast May 44 June Quarter Total 45 46 Purchases ($) 47 48 Amount paid in month of purchase 49 Amount paid in following month 50 Total Payments 51 52 Accounts payable Balance at month-end 53 54 A B 0 D E F G H Forecast Forecast Assumption Inputs Actual March Forecast April May June Quarter Total 55 Labour Budget 56 57 58 Purchases required (units) 59 Variable Labour per unit 60 Variable Labour Expense 61 62 Fixed Labour 63 Total Labour Expense 64 65 66 Labour paid during month earned 67 Labour paid in following month 68 Total cash impact of labour 69 70 Wages Payable at month-end 71 Master Budget + a A B D E F G H 73 74 General and Administration Budget Forecast Assumption Inputs Forecast April Forecast May 75 June Quarter Total 76 77 Sales (Units) 78 G&A per unit 79 Variable G&A Expense 80 81 Fixed G&A 82 Total G&A Expense 83 84 Less: Depreciation 85 G&A Cash Impact 86 87 88 89 90 Master Budget B E F G H Forecast Forecast April Forecast May June Quarter Total A 89 90 91 Cash Budget 92 93 94 Opening Balance 95 Add: Collections 96 Cash available 97 98 Disbursements 99 Merchandise 100 Labour 101 General and Administration 102 Fixed Asset Purchase 103 Dividends 104 Total Disbursements 105 106 Cash balance before financing Master Budget FRA I ibility Good to E F G D H B A 104 Total Disbursements 105 106 Cash balance before financing 107 Borrowing 108 Repayment 109 Interest Expense 110 Ending Balance 111 112 Line of Credit Balance at Month-end 113 114 Ending Inventory / COGS Budget 115 116 117 Cost per unit 118 119 Sales (Units) 120 Cost of Goods Sold 121 Master Budget Ready Accessibility: Good to go Forecast April Forecast May Forecast June Quarter Total 3 B D E F G H Forecast Forecast April Forecast May June Quarter Total A 114 Ending Inventory / COGS Budget 115 116 117 Cost per unit 118 119 Sales (Units) 120 Cost of Goods Sold 121 122 Beginning Inventory (units) 123 Purchases (units) 124 Sales (Units) 125 Ending Inventory (Units) 126 127 Value of Ending Inventory 128 129 Budgeted Income Statement 130 Forecast Forecast Forecast April May June Quarter Total Master Budget Ready 52. Accessibility: Good to go Forecast April Forecast May Forecast June Ouarter Total 128 129 Budgeted Income Statement 130 131 132 Sales 133 Cost of Goods Sold 134 Gross Profit 135 136 Labour 137 General and Administration (incl. Depreciation) 138 Total Expenses 139 140 Net Income before tax 141 1142 143 Budgeted Balance Sheet 144 Forecast Forecast Actual March Forecast Anril 145 June Master Budget Ready tAccessibility: Good to go A B D E G H Actual March Forecast April Forecast May Forecast June 143 Budgeted Balance Sheet 144 145 146 147 Cash 148 Accounts Receivable 149 Merchandise Inventory 150 Fixed Assets 151 Less: Depreciation 152 Total Assets 153 154 Accounts payable 155 Wages Payable 156 Line of credit 157 Total Liabilities 158 159 Common Shares 160 Retained Earnings Master Budget $110,000 $418,410 $360,000 $1,000,000 -$360,000 $1,528,410 $189,000 $29,200 $0 $218,200 $1,104,000 $206,210
Step by Step Solution
There are 3 Steps involved in it

Get step-by-step solutions from verified subject matter experts