

Question: OM215-Quantitative Methods for Mgt OM215 Assignment 3A [11 The marks obtained out of25 by 39 students of a class in the examination are given below
OM215-Quantitative Methods for Mgt
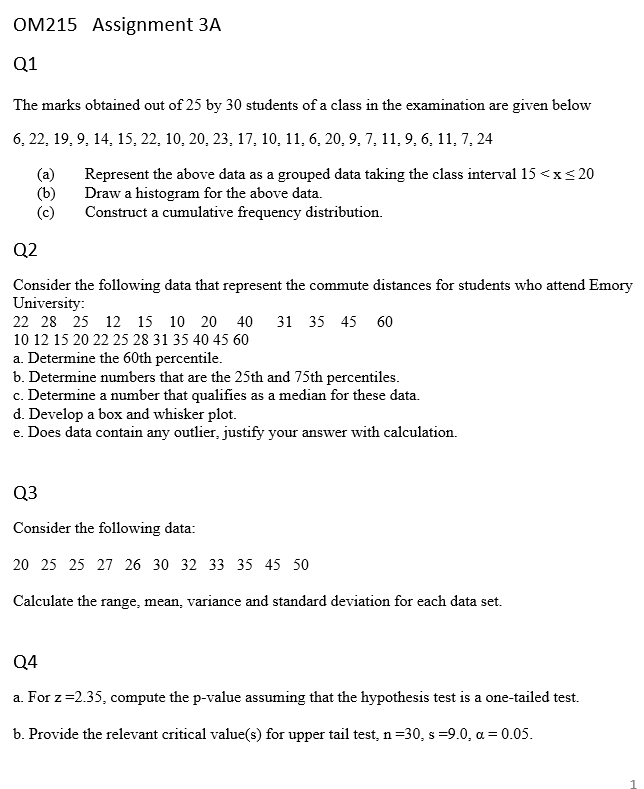
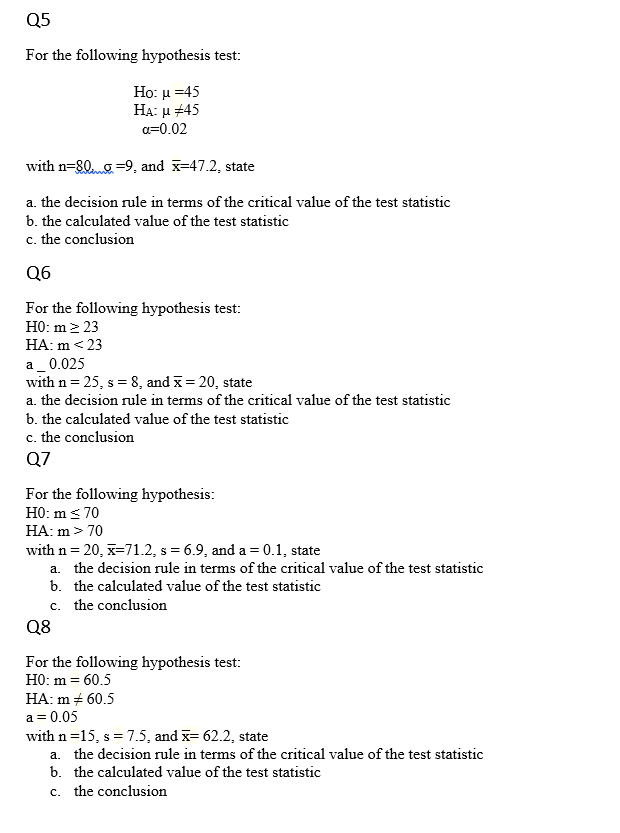
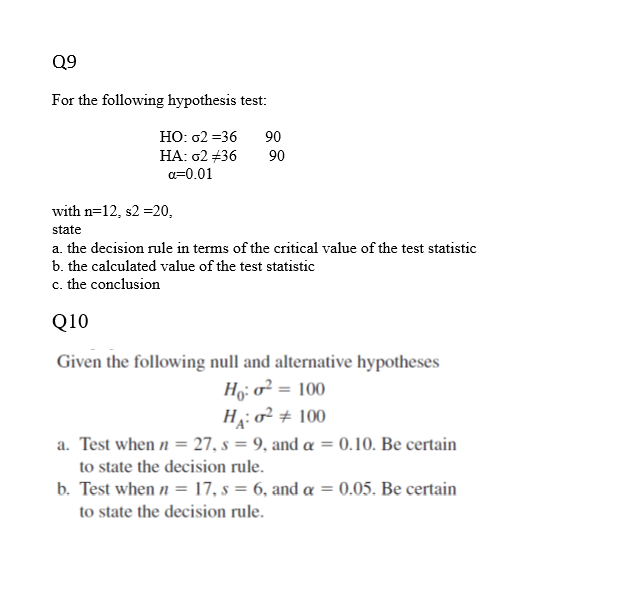
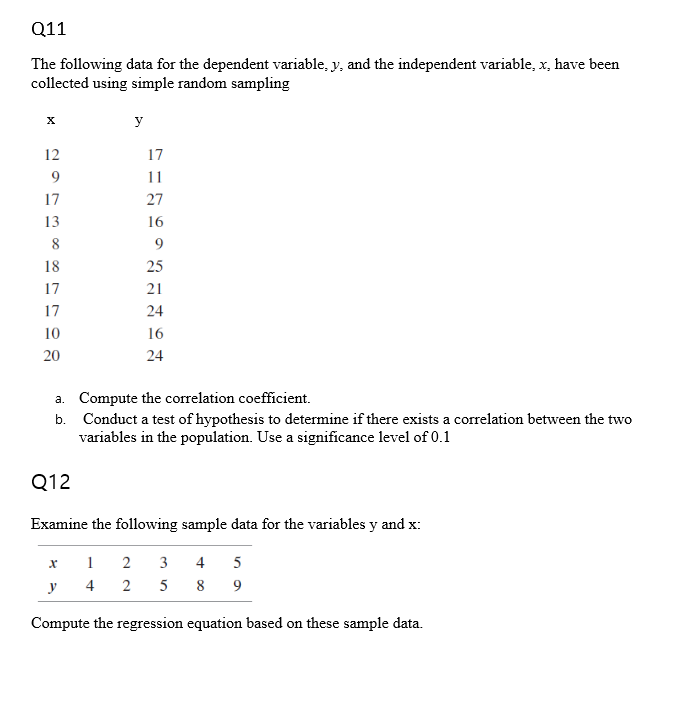
OM215 Assignment 3A [11 The marks obtained out of25 by 39 students of a class in the examination are given below 6, 22,19, 9,14,15, 22,119, 21.1, 23, 17, Ill, 11, 6, 21.1, 9, 7,11, 9, 6,11, 7, 24 (a) Represent the above data as a grouped data taking the class interval 15 {-1 xi: 2!] {13) Draw a histogram for the above data. (c) Construct a cumulative equency distribution. (12 Consider the following data that represent the commute distances for students who attend Emory University: 22 2B 25 12 15 11] 21] 4t] 31 35 45 61] 11.11215 2922 25 23 3135 41145 61] a. Determine the 60th percentile. b. Determine mmibers that are the 25th and 25th percentiles. c. Determine a number that qualies as a median for these data d. Develop a box and whisker plot. e. Does data contain any outlier, justify your answer with calculation. Q3 Consider the following data: 211 25 25 2? 26 31] 32 33 35 45 5t] Calculate the range, mean, variance and standard deviation for each data set. 14 a. For 2 =2-35, compute the pvalue assuming that the hypothesis test is a onetailed test. b. Provide the relevant critical valuetis] for upper tail test, n =30, s =9., d = 9.95. Q5 For the following hypothesis test: Ho: u =45 HA: u +45 a=0.02 with n=80 6 =9, and x=47.2, state a. the decision rule in terms of the critical value of the test statistic b. the calculated value of the test statistic c. the conclusion Q6 For the following hypothesis test: HO: m > 23 HA: m 70 with n = 20, x=71.2, s = 6.9, and a = 0.1, state a. the decision rule in terms of the critical value of the test statistic b. the calculated value of the test statistic c. the conclusion Q8 For the following hypothesis test: HO: m = 60.5 HA: m # 60.5 a = 0.05 with n =15, s =7.5, and x= 62.2, state a. the decision rule in terms of the critical value of the test statistic b. the calculated value of the test statistic c. the conclusionQ9 For the following hypothesis test: HO: 62 =36 90 HA: 62 #36 90 a=0.01 with n=12, s2 =20, state a. the decision rule in terms of the critical value of the test statistic b. the calculated value of the test statistic c. the conclusion Q10 Given the following null and alternative hypotheses Ho: 02 = 100 H: 02 # 100 a. Test when n = 27, s = 9, and a = 0.10. Be certain to state the decision rule. b. Test when n = 17, s = 6, and a = 0.05. Be certain to state the decision rule.Q11 The following data for the dependent variable, y, and the independent variable, x, have been collected using simple random sampling X y 12 17 9 11 17 27 16 25 21 24 16 24 . Compute the correlation coefficient. b. Conduct a test of hypothesis to determine if there exists a correlation between the two variables in the population. Use a significance level of 0.1 Q12 Examine the following sample data for the variables y and x: x 2 5 8 Compute the regression equation based on these sample data
Step by Step Solution
There are 3 Steps involved in it

Get step-by-step solutions from verified subject matter experts