

Question: omework: Chapter 2 Marketing by the Numbers Sav core: 0 of 5 pts 1 of 1 (0 complete) HW Score: 096, 0015 Metrics 2.1 Question
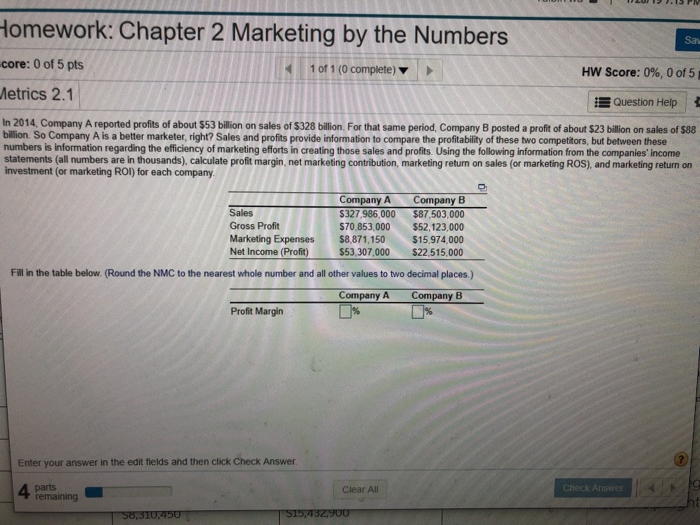
omework: Chapter 2 Marketing by the Numbers Sav core: 0 of 5 pts 1 of 1 (0 complete) HW Score: 096, 0015 Metrics 2.1 Question Help In 2014, Company A reported profits of about $53 billion on sales of $328 billion. For that same period, Company B posted a proft of abo $23 billion on sales of $88 bilion. So Company A is a better marketer, right? Sales and profits provide information to compare the profitability of these two competitors, but between these numbers is information regarding the efficiency of marketing efforts in creating those sales and profits. Using the following information from the companies income statements (all numbers are in thousands), calculate profit margin, net marketing contribution, marketing return on sales (or marketing ROS), and marketing return on investment (or marketing ROI) for each company Company A Company B Sales Gross Profit Marketing Expenses $8,871,150 $15,974,000 Net Income (Profit)$53.307,000$22,515,000 $70,853,000 $52,123,000 Fill in the table below. (Round the NMC to the nearest whole number and all other values to two decimal places.) Company A Company B Profit Margin Enter your answer in the edit fields and then click Check Answer parts remaining Clear All Check Answe
Step by Step Solution
There are 3 Steps involved in it

Get step-by-step solutions from verified subject matter experts