

Question: omework quiz 2.1 #1 stem plot The miles per gallon rating for 30 cars are shown below (lowest to highest). 19, 19, 19, 20,
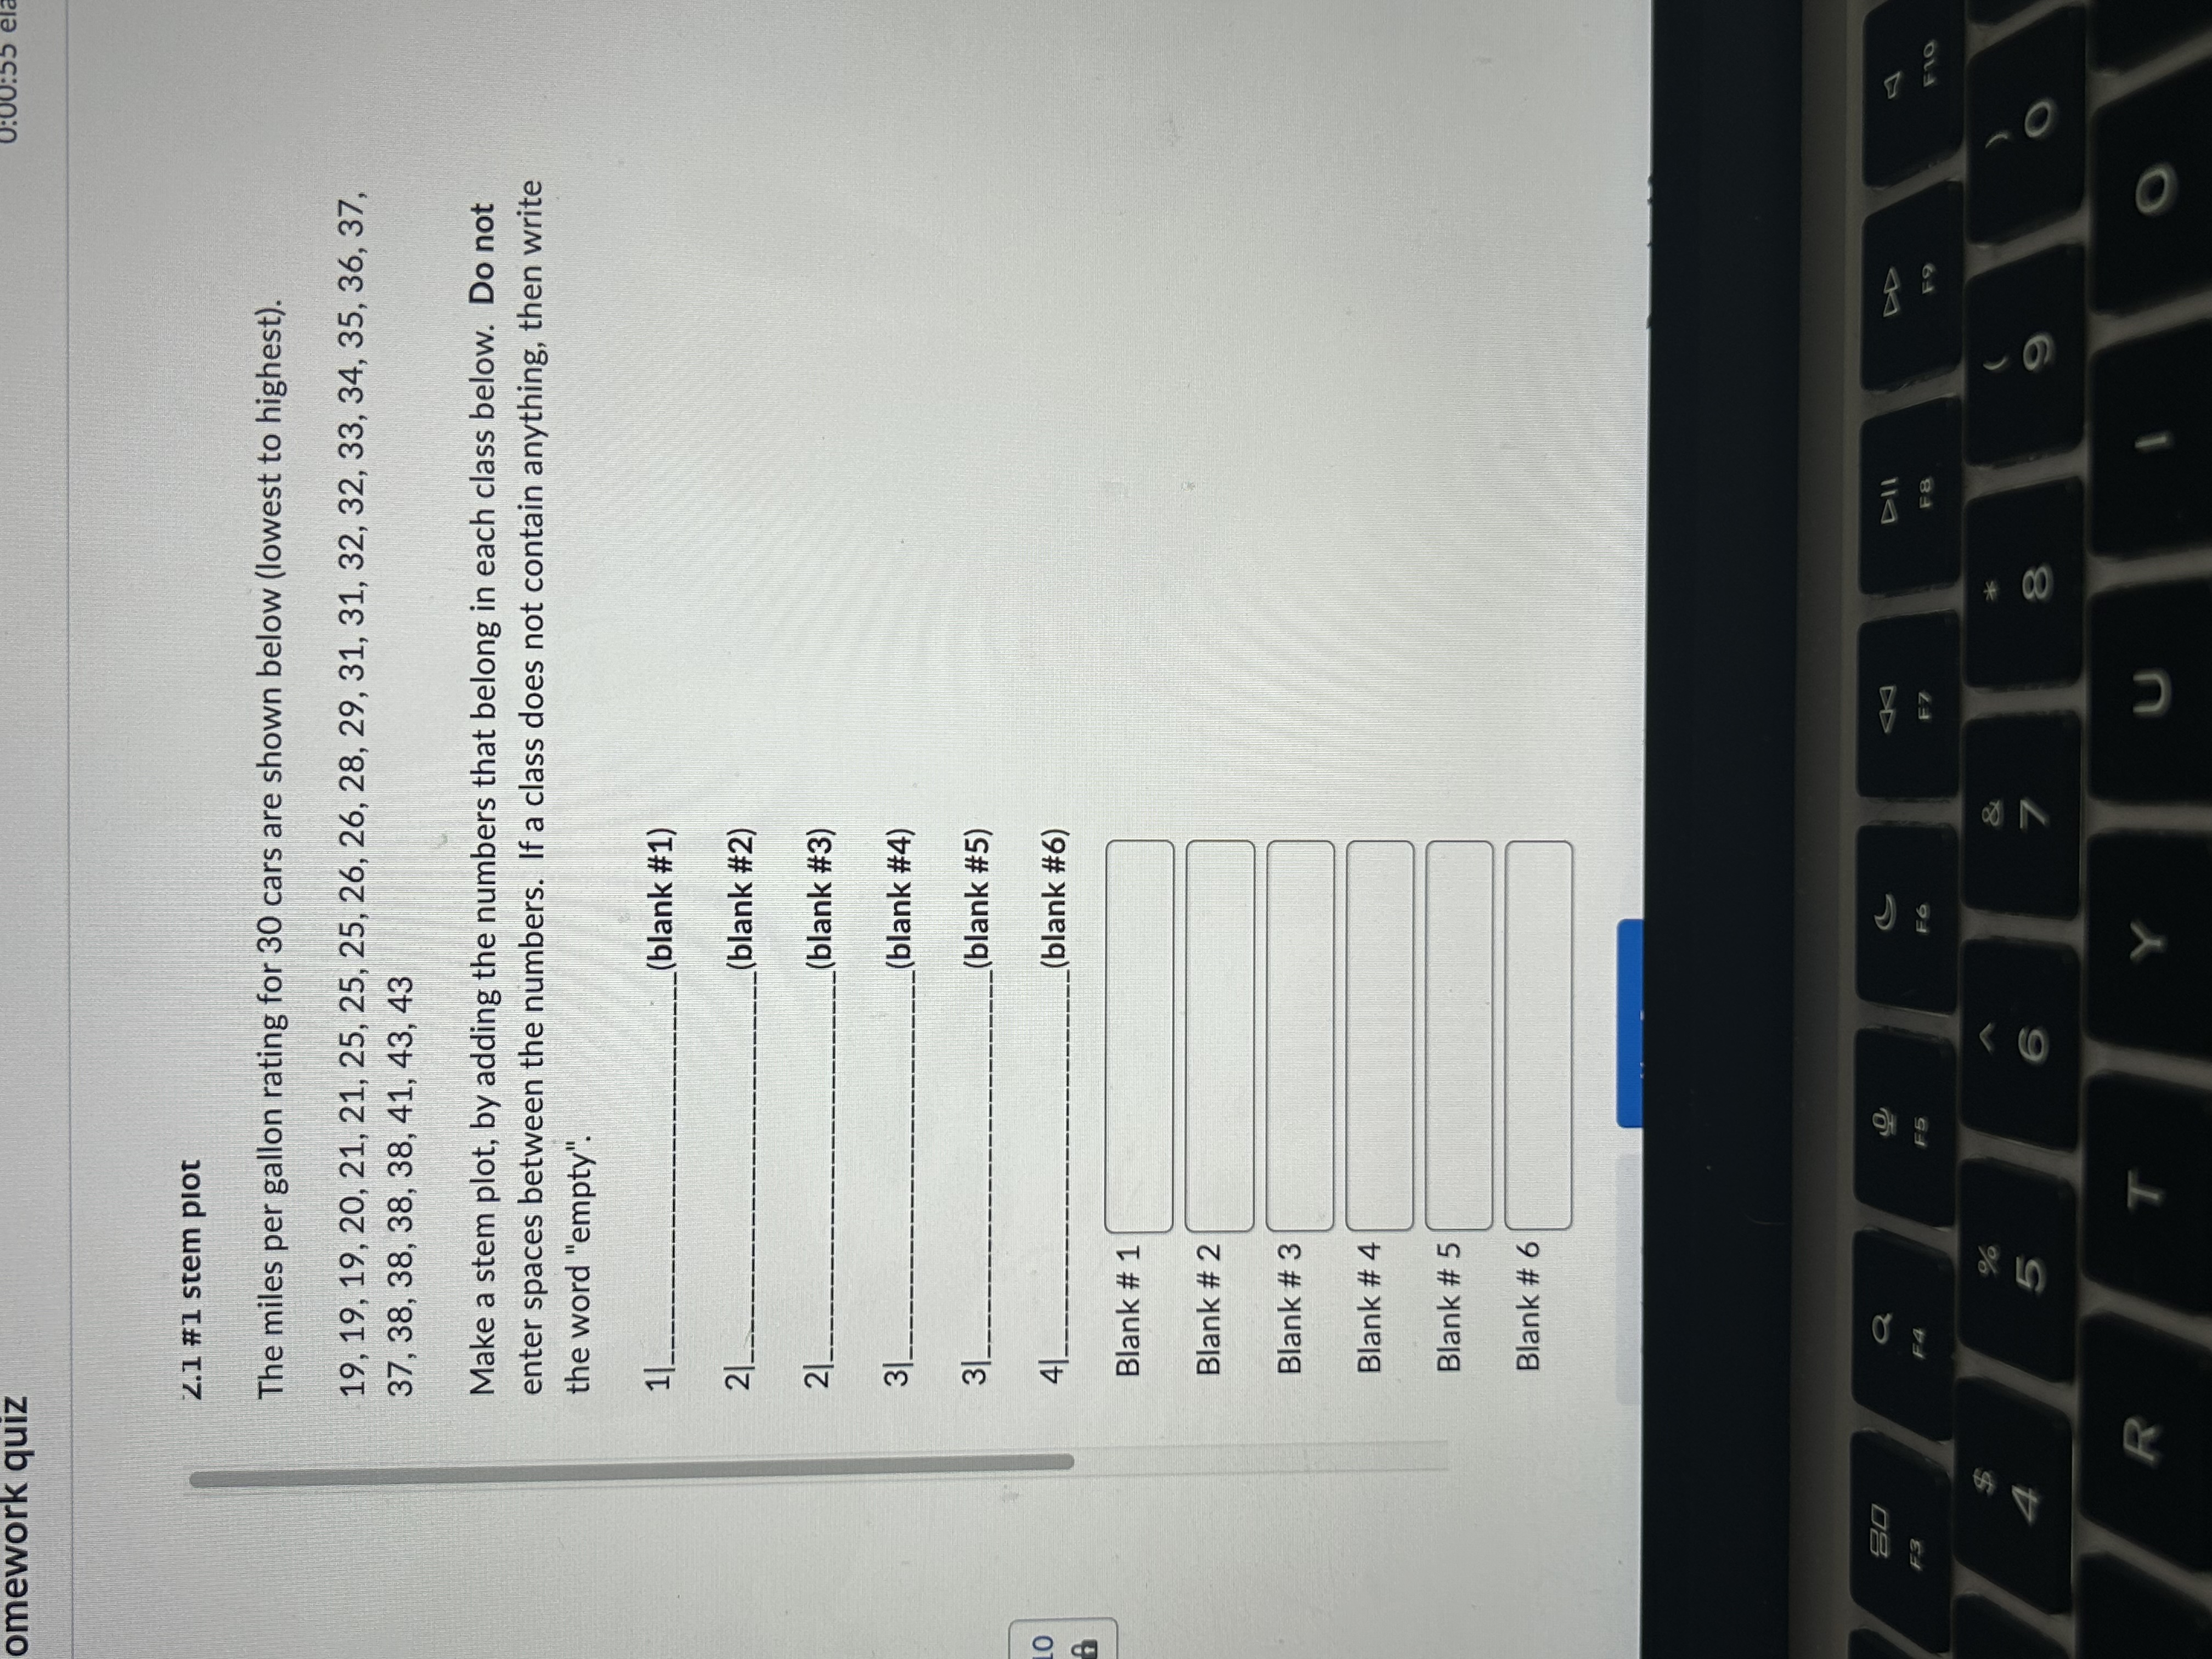
omework quiz 2.1 #1 stem plot The miles per gallon rating for 30 cars are shown below (lowest to highest). 19, 19, 19, 20, 21, 21, 25, 25, 25, 26, 26, 28, 29, 31, 31, 32, 32, 33, 34, 35, 36, 37, 37, 38, 38, 38, 38, 41, 43, 43 Make a stem plot, by adding the numbers that belong in each class below. Do not enter spaces between the numbers. If a class does not contain anything, then write the word "empty". _(blank #1) 21. (blank #2) 2|_ (blank #3) 3 (blank #4) 31 (blank #5) 10 41. (blank #6) 8 Blank # 1 Blank # 2 Blank # 3 Blank # 4 Blank # 5 Blank # 6 BABAT F3 F4 % 5 F6 & ABBA 7 R T Y F7 U * DII 0:00:55 ela F8 F9 F10 9E
Step by Step Solution
There are 3 Steps involved in it

Get step-by-step solutions from verified subject matter experts