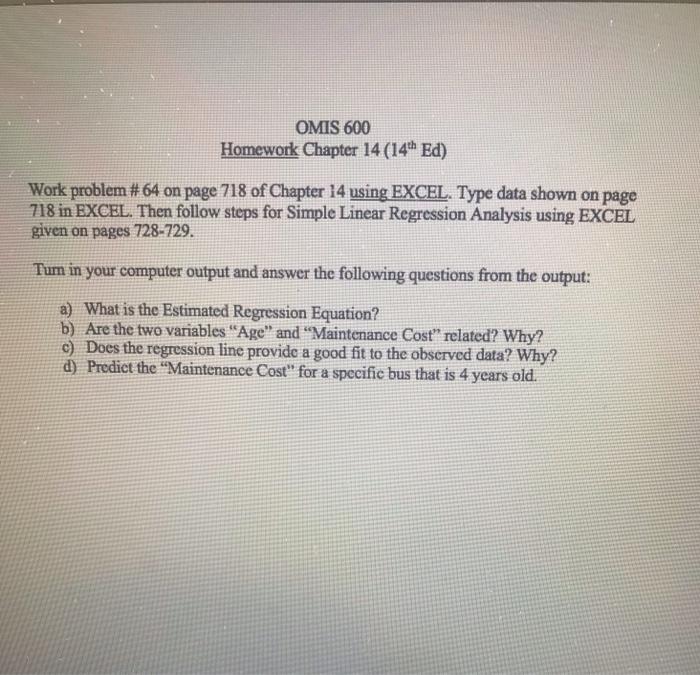
Question: OMIS 600 Homework Chapter 14 (14h Ed) Work problem #64 on page 718 of Chapter 14 using EXCEL. Type data shown on page 718 in

OMIS 600 Homework Chapter 14 (14h Ed) Work
OMIS 600 Homework Chapter 14 (14h Ed) Work problem #64 on page 718 of Chapter 14 using EXCEL. Type data shown on page 718 in EXCEL. Then follow steps for Simple Linear Regression Analysis using EXCEL given on pages 728-729. Turn in your computer output and answer the following questions from the output: a) What is the Estimated Regression Equation? b) Are the two variables "Age" and "Maintenance Cost" related? Why? c) Does the regression line provide a good fit to the observed data? Why? d) Predict the "Maintenance Cost" for a specific bus that is 4 years old. area wants miles from the company. 64. Bus Maintenance. The regional transit authority for a major metropolitan to determine whether there is any relationship between the age of a bus and the annual maintenance cost. A sample of 10 buses resulted in the following data. Age of Bus (years) 1 ile ANNNN - Maintenance Cost ($) 350 370 480 520 590 550 750 800 790 950 a. Develop the laat - 2 10 - 2 = 8.61 = 9501 1 - (9501)2 The t distribution table shows that with n - 2 - 10 - 2 - 8 degrees of freedom, t = 3.355 provides an area of .005 in the upper tail. Thus, the area in the upper tail of the distribu- tion corresponding to the test statistic t = 8.61 must be less than 2005. Because this test is a two-tailed test, we double this value to conclude that the p-value associated with 1 = 8.61 must be less than 20.005) = .01. Because the p-value is less than a = .01, we reject H, and conclude that pay is not equal to zero. This evidence is sufficient to conclude that a signific- ant linear relationship exists between student population and quarterly sales. Note that except for rounding, the test statistic and the conclusion of a significant relationship are identical to the results obtained in Section 14.5 for the t test conducted using Armand's estimated regression equation = 60 + 5x. Performing regression ana- lysis provides the conclusion of a significant relationship between x and y and in addition provides the equation showing how the variables are related. Most analysts therefore use modern computer packages to perform regression analysis and find that using correlation as a test of significance is unnecessary. Appendix 14.3 Simple Linear Regression with JMP In this appendix we describe how to use JMP to perform a simple linear regression. Step 1. Open the file Armand's with JMP using the steps provided in Appendix 1.1 Step 2. From the Data window containing the population and sales data, click Analyze and select Fit Y by X DATA file Armand's Armand's Piz ROLE SL Agen JMP Output for Lado Varane C Step 3. When the Fit Y by X-Contextual window appears: Drag Sales in the Select Columns area to the Y, Response box in the Cast Selected Columns into Roles area Drag Population in the Select Columns area to the X Factor box in the Cast Selected Columns into Roles area Click OK in the Action area Step 4. When the DataFit Y by X of Sales by Population window appears: Click on the red triangle next to Bivariate Fit of Sales by Population and select Fit Line The regression output appears as shown in Figure JMP 14.1. We see that the estimated regression equation is Sales = 60 + 5*Population. The R2 = 902734. The Analysis of Variance section indicates that the model is significant at the .01 level (F ratio = 74.2484) and Prob F Itl <.001 appendix regression analysis with excel ata ile in this we will illustrate how tool can ho the computations for>

Step by Step Solution

There are 3 Steps involved in it

1 Expert Approved Answer
Step: 1 Unlock blur-text-image
Question Has Been Solved by an Expert!

Get step-by-step solutions from verified subject matter experts

Step: 2 Unlock
Step: 3 Unlock

Students Have Also Explored These Related General Management Questions!