

Question: on 11 1 illustrate in a graph the table below. (5 marks), and a demand curve that will clearly show the performance of the price
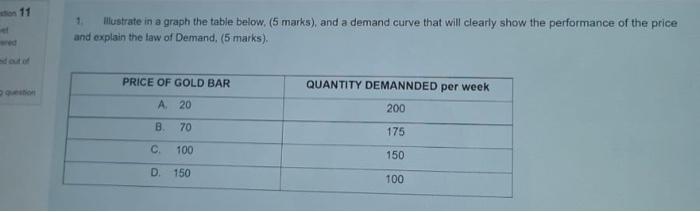
on 11 1 illustrate in a graph the table below. (5 marks), and a demand curve that will clearly show the performance of the price and explain the law of Demand, (5 marks), PRICE OF GOLD BAR QUANTITY DEMANNDED per week 200 A 20 . 70 175 C 100 150 D 150 100
Step by Step Solution
There are 3 Steps involved in it
1 Expert Approved Answer
Step: 1 Unlock

Question Has Been Solved by an Expert!
Get step-by-step solutions from verified subject matter experts
Step: 2 Unlock
Step: 3 Unlock