

Question: on 2015 Data obtained from WRDS: The attached file is based 1. Calculate the following: Sales Net Sales: Income =Income before extraordinary items: Assets Total
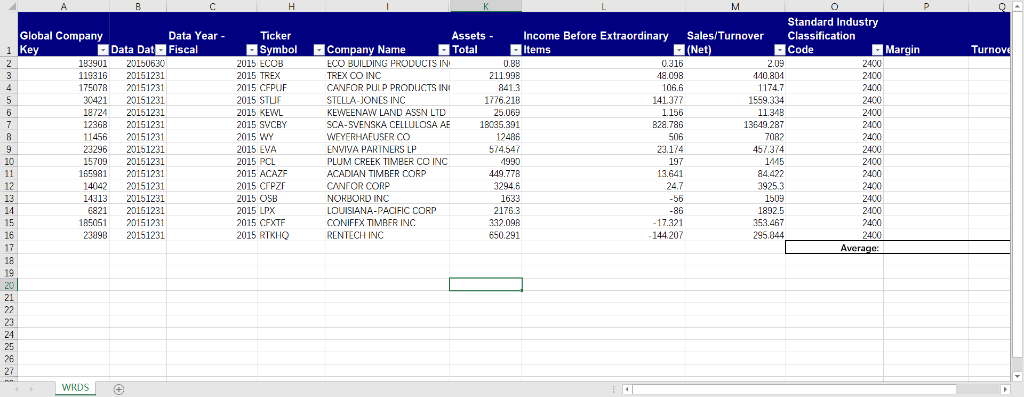
on 2015 Data obtained from WRDS: The attached file is based 1. Calculate the following: Sales Net Sales: Income =Income before extraordinary items: Assets Total Assets Margin Income/Sales b. Turnover Sales/Assets a. - Return on Investment = Income/Assets = ROI c. 2. Calculate the averages for the ab. & c. above. Use average function for the column 3. Find the company with the highest ROI. Using the ticker symbol and Yahoo Finance Provide a summary including the following in a text box within the Excel file: Give the company name and ticker symbol a. b. 2015 ROI Current or most Recent CEO d. Current or most recent address for company quarters C. K De H Standard Industry Global Company Key Data Year Data Dat Fiscal Income Before Extraordinary Items Sales/Turnover Ticker Assets Classification Company Name ECO BUILDING PRODUCTS IN (Net) Code Margin Symbol Total Turnove 08B 183901 20150630 2015 ECOB 0.316 2.09 2400 211 1174 175078 CANFOR PULP PRODUCTS IN STELLA-JONES INC . 2015 CEPUE 106 6 20151231 30421 20151231 2015 STUP 1776.218 141.377 1559.334 2400 6 KEWEENAW LAND ASSN LTD 11.34B 18724 20151231 2015 KEWL 25.069 1156 2400 LULOSA AB BY 1B035. 12409 28 136 MEVERHAFUSER CO 7022 wo 20151231 2015 wY 20151231 2015 EVA 574547 23.174 457374 1445 2400 9 23296 ENVIVA PARINERS LP 2100 10 15709 20151231 2015 PCL PLUM CREEK TIMBER CO INC 1990 19 CORP 165981 2015 ACAZF 449.77B 11 4LAL LN IM 1633 1509 2400 13 14313 20151231 2015 OSB NORBORD INC -56 LOUISIANA-PACIFIC CORP CONIFFX TIMBER INC 2400 14 6821 20151231 2015 LPX 2176.3 -86 1892.5 332.09B -17.321 2400 15 185051 20151231 2015 CFXTF 353.467 650.291 144207 23898 20151231 2015 RTKHQ RENTECH INC 295.044 Average: 18 19 20 21 23 24 25 27 WRDS on 2015 Data obtained from WRDS: The attached file is based 1. Calculate the following: Sales Net Sales: Income =Income before extraordinary items: Assets Total Assets Margin Income/Sales b. Turnover Sales/Assets a. - Return on Investment = Income/Assets = ROI c. 2. Calculate the averages for the ab. & c. above. Use average function for the column 3. Find the company with the highest ROI. Using the ticker symbol and Yahoo Finance Provide a summary including the following in a text box within the Excel file: Give the company name and ticker symbol a. b. 2015 ROI Current or most Recent CEO d. Current or most recent address for company quarters C. K De H Standard Industry Global Company Key Data Year Data Dat Fiscal Income Before Extraordinary Items Sales/Turnover Ticker Assets Classification Company Name ECO BUILDING PRODUCTS IN (Net) Code Margin Symbol Total Turnove 08B 183901 20150630 2015 ECOB 0.316 2.09 2400 211 1174 175078 CANFOR PULP PRODUCTS IN STELLA-JONES INC . 2015 CEPUE 106 6 20151231 30421 20151231 2015 STUP 1776.218 141.377 1559.334 2400 6 KEWEENAW LAND ASSN LTD 11.34B 18724 20151231 2015 KEWL 25.069 1156 2400 LULOSA AB BY 1B035. 12409 28 136 MEVERHAFUSER CO 7022 wo 20151231 2015 wY 20151231 2015 EVA 574547 23.174 457374 1445 2400 9 23296 ENVIVA PARINERS LP 2100 10 15709 20151231 2015 PCL PLUM CREEK TIMBER CO INC 1990 19 CORP 165981 2015 ACAZF 449.77B 11 4LAL LN IM 1633 1509 2400 13 14313 20151231 2015 OSB NORBORD INC -56 LOUISIANA-PACIFIC CORP CONIFFX TIMBER INC 2400 14 6821 20151231 2015 LPX 2176.3 -86 1892.5 332.09B -17.321 2400 15 185051 20151231 2015 CFXTF 353.467 650.291 144207 23898 20151231 2015 RTKHQ RENTECH INC 295.044 Average: 18 19 20 21 23 24 25 27 WRDS
Step by Step Solution
There are 3 Steps involved in it

Get step-by-step solutions from verified subject matter experts