

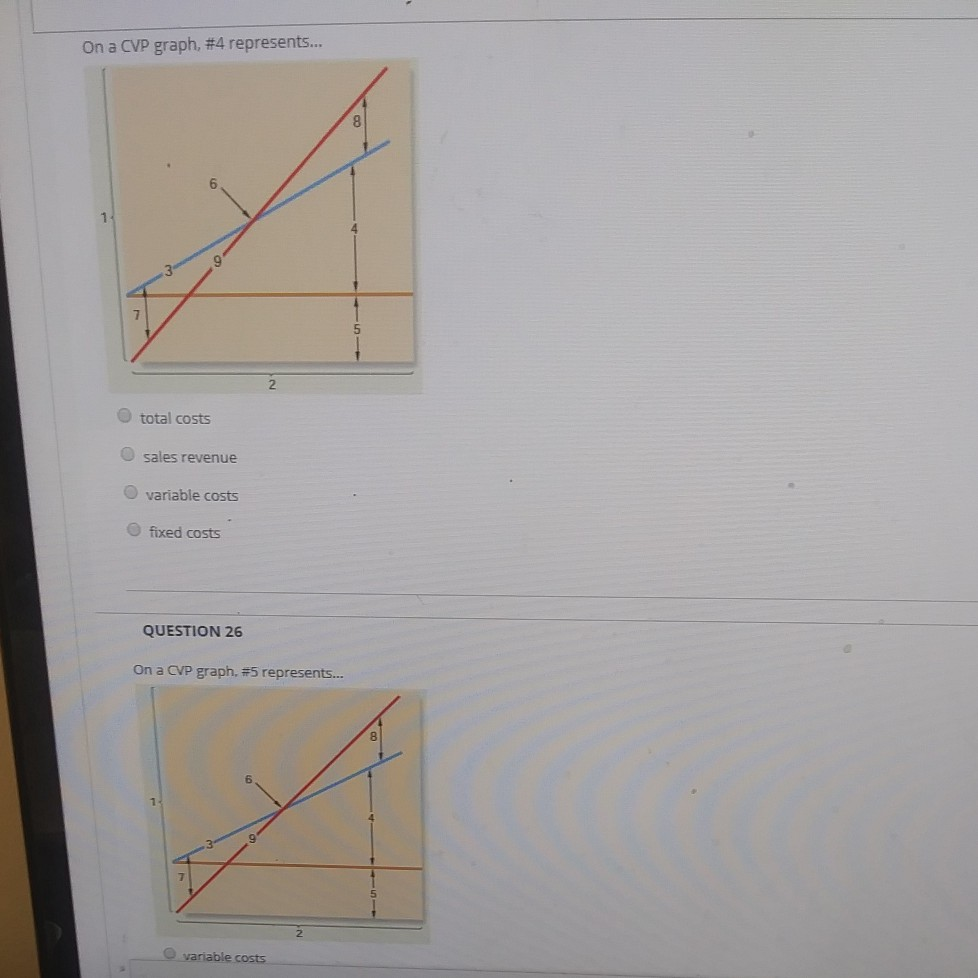
Question: On a CVP graph, #4 represents... 8 total costs sales revenue variable costs fixed costs QUESTION 26 On a CVP graph. #5 represents... variable costs
On a CVP graph, #4 represents... 8 total costs sales revenue variable costs fixed costs QUESTION 26 On a CVP graph. #5 represents... variable costs
Step by Step Solution
There are 3 Steps involved in it
1 Expert Approved Answer
Step: 1 Unlock

Question Has Been Solved by an Expert!
Get step-by-step solutions from verified subject matter experts
Step: 2 Unlock
Step: 3 Unlock