

Question: On Excel on a graph scale call accordingly thank you i just need 2 or 3 graphs om excel that shows all that data on
On Excel on a graph scale call accordingly
thank you
i just need 2 or 3 graphs om excel that shows all that data on the x axies and y axies so I can input values
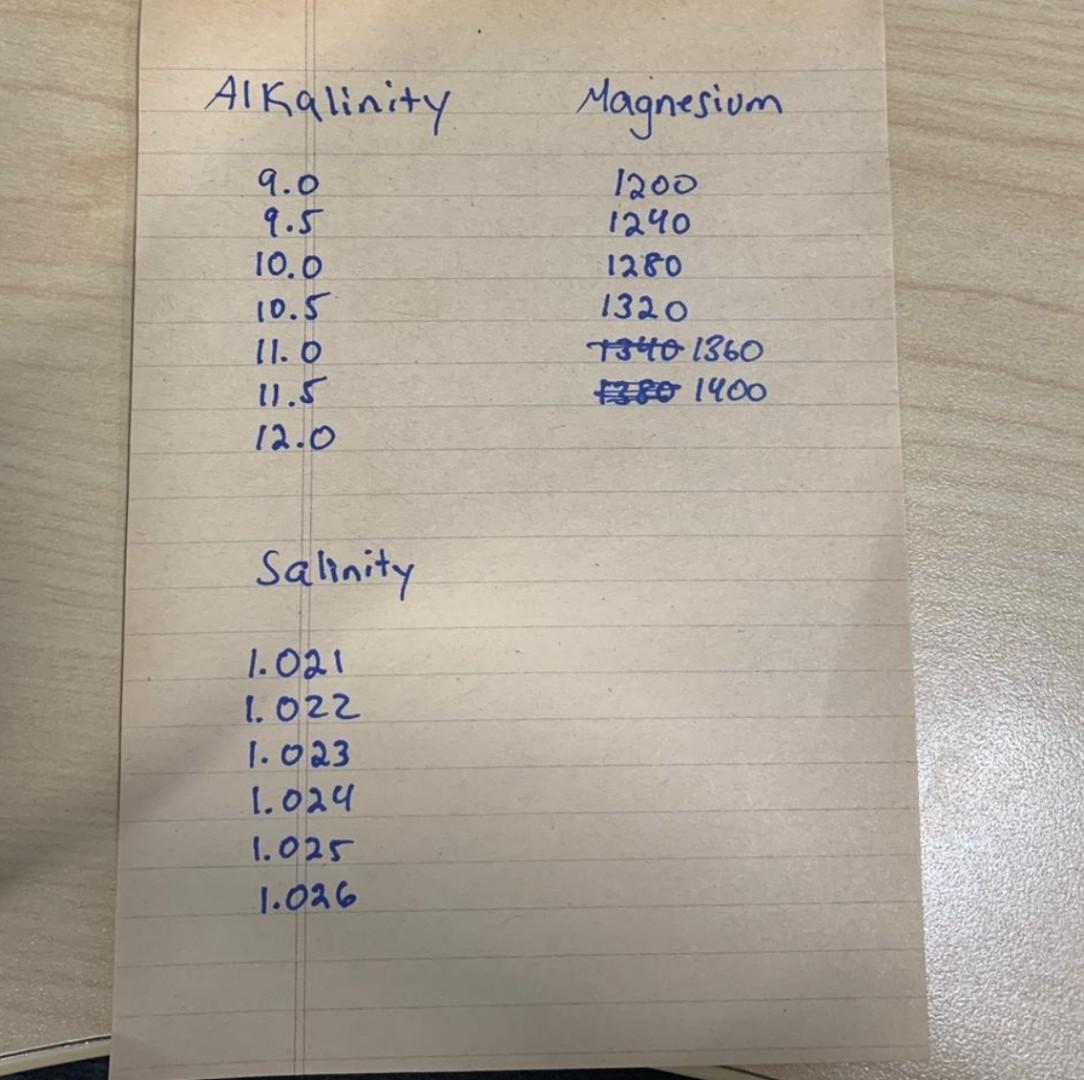
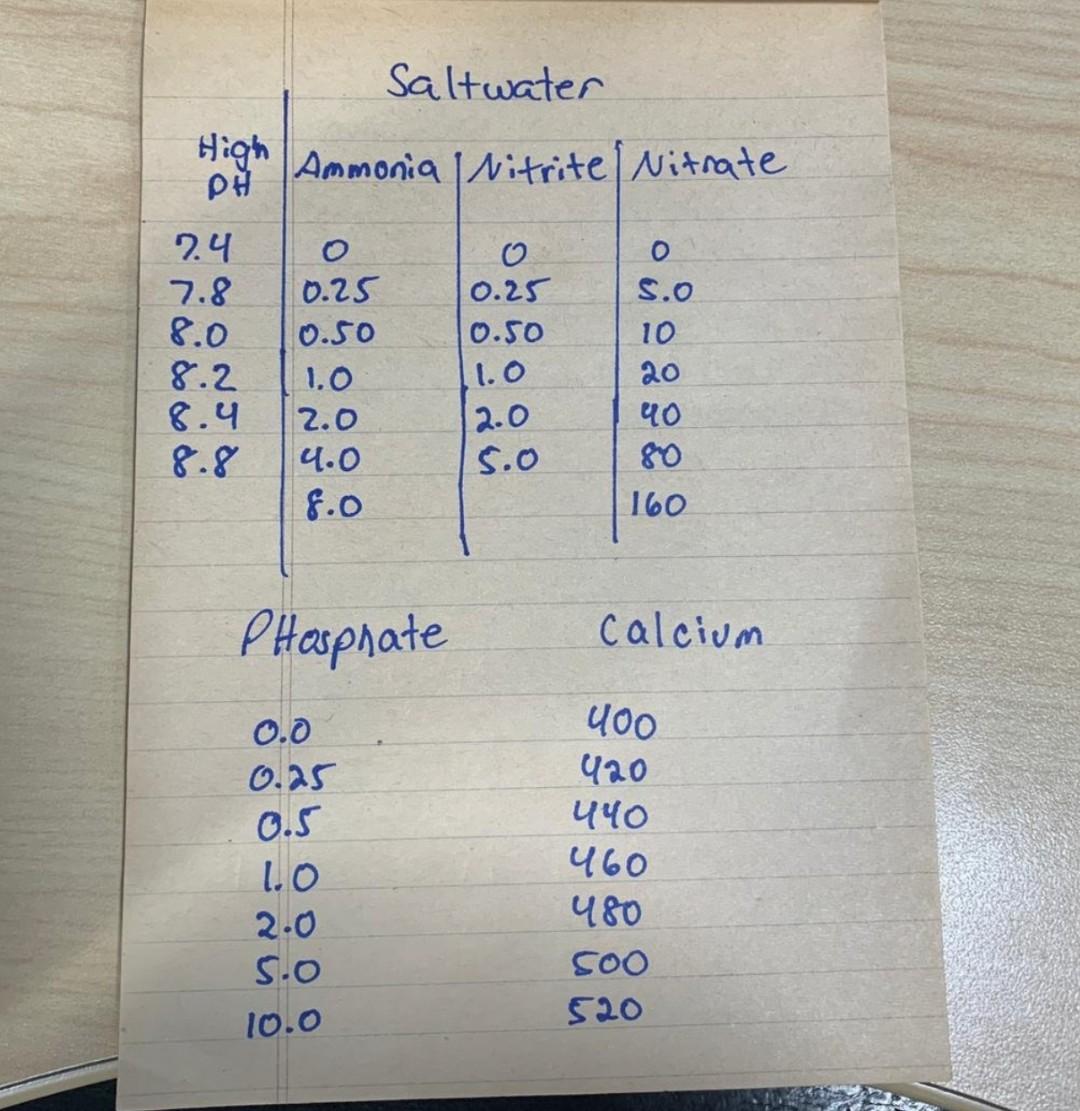
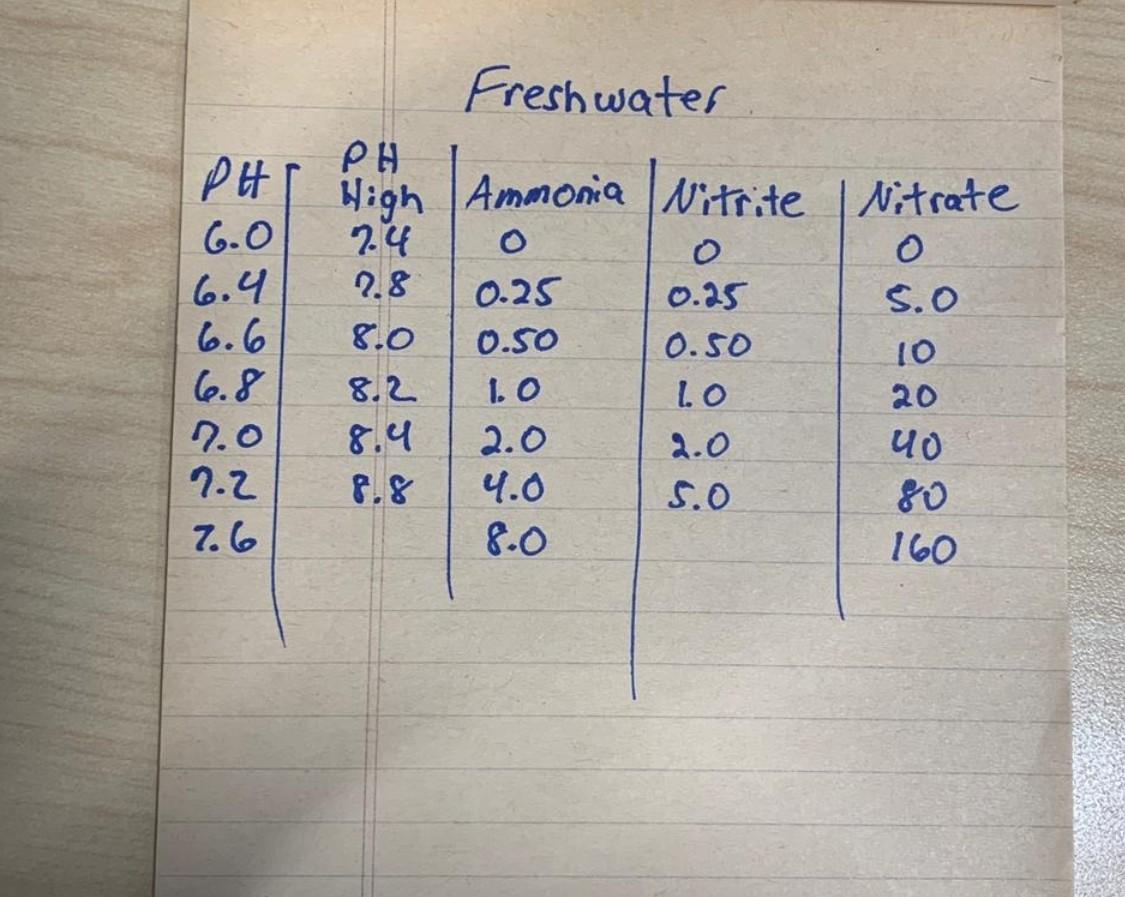
Alkalinity Magnesium 9.0 9.5 10.0 10.5 11.0 1.5 12.0 1200 1240 1280 1320 Tuto 1360 o 1400 Salinity 1.021 1.022 1.023 1.024 1.025 1.026 Saltwater High Ammonia Nitrite Nitrate 24 7.8 8.0 8.2 8.4 8.8 o 0.25 0.50 1.0 2.0 4.0 8.0 0.25 0.50 1.0 2.0 5.o O 8.0 10 20 80 160 Phosphate Calcium 0.0 0.25 0.5 1.0 2.0 S.O 10.0 400 420 460 480 SOO 520 PHT 6.0 6.4 6.6 6.8 2.0 7.2 7.6 Freshwater PH Wigh Ammonia Nitrite Nitrate 2.4 O 2.8 0.25 0.25 S.O 8.0 0.50 0.50 10 8.2 1. O LO 20 8.4 2.0 2.0 4.0 5.0 8.0 160
Step by Step Solution
There are 3 Steps involved in it

Get step-by-step solutions from verified subject matter experts