

Question: on Fitting Lines to Data a regression model was constructed by the Colorado Climate Center to forecast the states seasonal water supply. It is based
on Fitting Lines to Data a regression model was constructed by the Colorado Climate Center to forecast the states seasonal water supply. It is based on the relationship between snow in the mountains and annual runoff in streams. Annual runoff is the Y response or dependent variable, and snow water equivalent is the X explanatory or independent variable. You can see the scatterplot.
a.How many acre feet of water would the model predict if there were 50 inches of snow water equivalent?
b. What would an R2 (R-squared) of .72 or 72% mean in the context of the problem
c. Interpret the slope coefficient of 1,762 in the context of the problem. (Make sure you use the correct units.)
d. If you set your significance level at .01 to test the slope coefficient (snow water equivalent) for a positive linear relationship, and if the p-value for the snow water equivalent coefficient is calculated as .004, what decision would you make about accepting or rejecting the null hypothesis of linearity? State your decision to either reject or fail to reject. Interpret what that means.
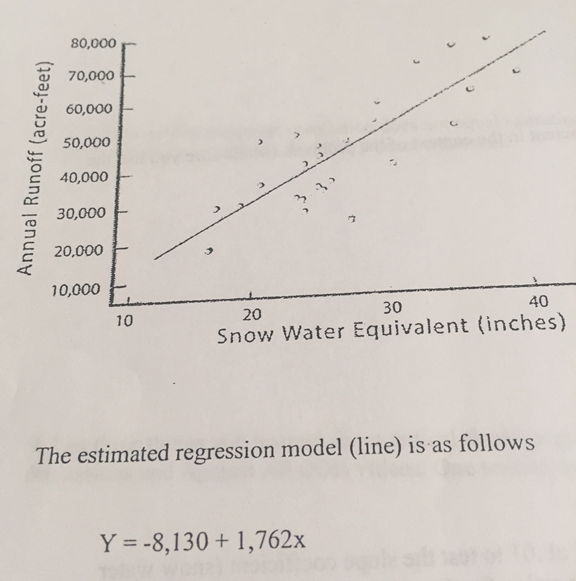
80,000 70,000 60,000 50,000 Annual Runoff (acre-feet) 40,000 30,000 20,000 10,000 10 20 30 40 Snow Water Equivalent (inches) The estimated regression model (line) is as follows Y = -8,130 + 1,762x
Step by Step Solution
There are 3 Steps involved in it

Get step-by-step solutions from verified subject matter experts