

Question: On microsoft Excel, this is an assignment ive been trying to work on. Tools OMGT 3123 Ch... OMGT 3123 Ch... * starting TABLE 1. Historical
On microsoft Excel, this is an assignment ive been trying to work on. 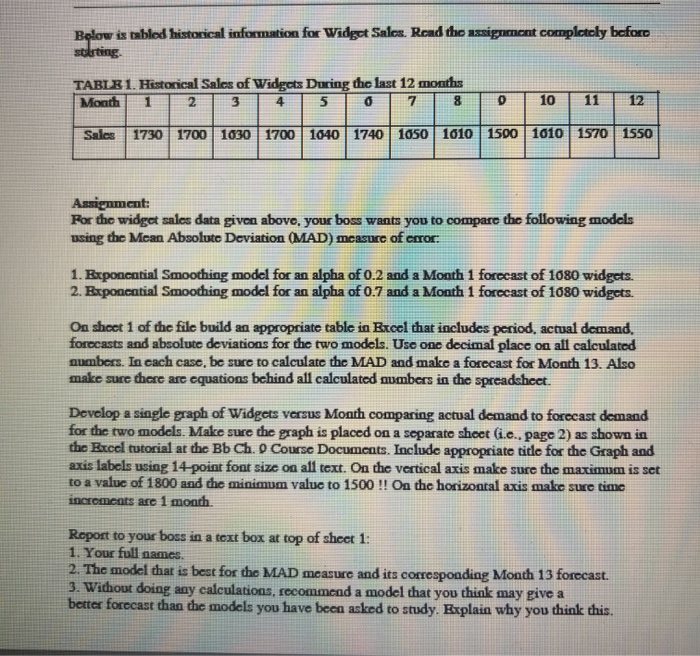
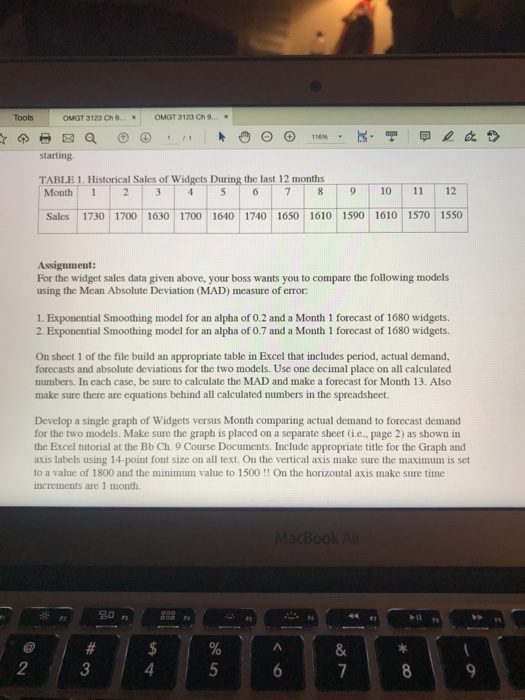
Tools OMGT 3123 Ch... OMGT 3123 Ch... * starting TABLE 1. Historical Sales of Widgets During the last 12 months Month 1 2 3 4 5 6 7 8 9 10 Sales 1730 1700 1630 1700 1640 1740 1650 1610 1590 1610 1570 1550 Assignment: For the widget sales data given above, your boss wants you to compare the following models using the Mean Absolute Deviation (MAD) measure of error: 1. Exponential Smoothing model for an alpha of 0.2 and a Month 1 forecast of 1680 widgets. 2. Exponential Smoothing model for an alpha of 0.7 and a Month 1 forecast of 1680 widgets. On sheet 1 of the file build an appropriate table in Excel that includes period, actual demand, forecasts and absolute deviations for the two models. Use one decimal place on all calculated numbers. In cach case, be sure to calculate the MAD and make a forecast for Month 13. Also make sure there are equations behind all calculated numbers in the spreadsheet. Develop a single graph of Widgets versus Month comparing actual demand to forecast demand for the two models. Make sure the graph is placed on a separate sheet (ie., page 2) as shown in the Excel tutorial at the Bb Ch. 9 Course Documents. Include appropriate title for the Graph and axis labels using 14-point font size on all text. On the vertical axis make sure the maximum is set to a value of 1800 and the minimum value to 1500 !! On the horizontal axis make sure time increments are 1 month Below is tablod historical information for Widget Salos. Read the assignment completely before starting TABLE 1. Historical Sales of Widgets During the last 12 months Month D 10 1010 11 1570 12 1550 Sales 1730 1700 1030 1700 1640 1740 1050 1010 1500 Assignment: For the widget sales data given above, your boss wants you to compare the following models using the Moan Absolute Deviation (MAD) measure of error 1. Exponential Smoothing model for an alpha of 0.2 and a Month 1 forecast of 1080 widgets. 2. Exponential Smoothing model for an alpha of 0.7 and a Month 1 forecast of 1080 widgets. On sheet 1 of the file build an appropriate table in Excel that includes period, actual demand, forecasts and absolute deviations for the two models. Use one decimal place on all calculated numbers. In cach case, be sure to calculate the MAD and make a forecast for Month 13. Also make sure there are equations behind all calculated numbers in the spreadsheet. Develop a single graph of Widgets versus Month comparing actual demand to forecast demand for the two models. Make sure the graph is placed on a separate sheet (i.e., page 2) as shown in the Excel tutorial at the Bb Ch. 0 Course Documents. Include appropriate title for the Graph and axis labels using 14-point font size on all text. On the vertical axis make sure the maximum is set to a value of 1800 and the minimum value to 1500 !! On the horizontal axis make sure time incroments are 1 month. Report to your boss in a text box at top of sheet 1: 1. Your full names. 2. The model that is best for the MAD measure and its corresponding Month 13 forecast. 3. Without doing any calculations, recommend a model that you think may give a better forecast than the models you have been asked to study. Explain why you think this Step by Step Solution
There are 3 Steps involved in it
1 Expert Approved Answer
Step: 1 Unlock

Question Has Been Solved by an Expert!
Get step-by-step solutions from verified subject matter experts
Step: 2 Unlock
Step: 3 Unlock