

Question: You will find selected ratios for a company over a two-year period. Compare the ratios, and in a separate document (Word or Excel), submit your
You will find selected ratios for a company over a two-year period. Compare the ratios, and in a separate document (Word or Excel), submit your answers to the following questions:
- What does the calculation of each ratio represent?
- How does year one compare with year two, and what trend can be seen when you compare the two years?
- Is the trend from year one to year two positive or negative?
- What are the possible reasons for the trend?
- What recommendations do you have for turning a negative trend to a positive trend?
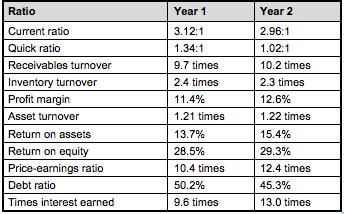
Ratio Year 1 Year 2 Current ratio 3.12:1 2.96:1 Quick ratio 1.34:1 1.02:1 Receivables turnover 9.7 times 10.2 times Inventory turnover Profit margin 2.4 times 2.3 times 11.4% 12.6% Asset turnover 1.21 times 1.22 times Return on assets 13.7% 15.4% Return on equity 28.5% 29.3% Price-earnings ratio 10.4 times 12.4 times Debt ratio 50.2% 45.3% Times interest earned 9.6 times 13.0 times
Step by Step Solution
3.54 Rating (158 Votes )
There are 3 Steps involved in it
Solution 1 Current Ratio Current ratio is the liquidity ratio that determines shortterm debtpaying ability It evaluates a firms overall liquidity position considering current assets and current liabil... View full answer

Get step-by-step solutions from verified subject matter experts