

Question: on the bottom portion. how do I get the Ratio calculations? 3. Ccmmon size the AMHS Sratement of Reyenve ano Expenses for each categorg. 8

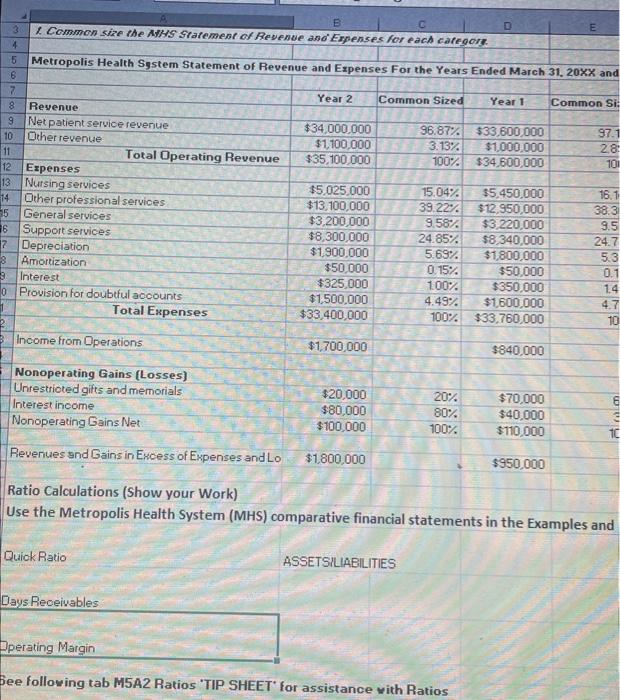
3. Ccmmon size the AMHS Sratement of Reyenve ano Expenses for each categorg. 8 Revenue Year 2 Common Sized Year 1 9 Net patient service revenue Dtherrevenue Total Dperating Revenue Expenses Nursing services Qther protessional services General services Support services Depreoiation Amortization Interest Provision for doubtful acoounts Total Expenses \begin{tabular}{|r|r|r|r|} \hline$5,025,000 & 15.04% & $5,450,000 & 16.1 \\ \hline$13,100,000 & 39.22% & $12,950,000 & 38.3 \\ \hline$3,200,000 & 9.58% & $3,220,000 & 9.5 \\ \hline$8,300,000 & 24.85% & $8,340,000 & 24.7 \\ \hline$1,900,000 & 5.69% & $1,800,000 & 5.3 \\ \hline$50,000 & 0,15% & $50,000 & 0.1 \\ \hline$325,000 & 1.00% & $350,000 & 1.4 \\ \hline$33,400,000 & 4.49% & $1,600,000 & 4.7 \\ \hline \end{tabular} Income from Qperations $1,700,000 $840,000 Nonoperating Gains (Losses) Unrestrioted gitts and memorials Interest income Nonoperating Gains Net Ratio Calculations (Show your Work) Use the Metropolis Health System (MHS) comparative financial statements in the Examples and Quick Ratio ASSETSILIABILITIES Days Receivables Bperating Margin bee following tab M5A2 Ratios 'TIP SHEET' for assistance with Ratios 3. Ccmmon size the AMHS Sratement of Reyenve ano Expenses for each categorg. 8 Revenue Year 2 Common Sized Year 1 9 Net patient service revenue Dtherrevenue Total Dperating Revenue Expenses Nursing services Qther protessional services General services Support services Depreoiation Amortization Interest Provision for doubtful acoounts Total Expenses \begin{tabular}{|r|r|r|r|} \hline$5,025,000 & 15.04% & $5,450,000 & 16.1 \\ \hline$13,100,000 & 39.22% & $12,950,000 & 38.3 \\ \hline$3,200,000 & 9.58% & $3,220,000 & 9.5 \\ \hline$8,300,000 & 24.85% & $8,340,000 & 24.7 \\ \hline$1,900,000 & 5.69% & $1,800,000 & 5.3 \\ \hline$50,000 & 0,15% & $50,000 & 0.1 \\ \hline$325,000 & 1.00% & $350,000 & 1.4 \\ \hline$33,400,000 & 4.49% & $1,600,000 & 4.7 \\ \hline \end{tabular} Income from Qperations $1,700,000 $840,000 Nonoperating Gains (Losses) Unrestrioted gitts and memorials Interest income Nonoperating Gains Net Ratio Calculations (Show your Work) Use the Metropolis Health System (MHS) comparative financial statements in the Examples and Quick Ratio ASSETSILIABILITIES Days Receivables Bperating Margin bee following tab M5A2 Ratios 'TIP SHEET' for assistance with Ratios 3. Ccmmon size the AMHS Sratement of Reyenve ano Expenses for each categorg. 8 Revenue Year 2 Common Sized Year 1 9 Net patient service revenue Dtherrevenue Total Dperating Revenue Expenses Nursing services Qther protessional services General services Support services Depreoiation Amortization Interest Provision for doubtful acoounts Total Expenses \begin{tabular}{|r|r|r|r|} \hline$5,025,000 & 15.04% & $5,450,000 & 16.1 \\ \hline$13,100,000 & 39.22% & $12,950,000 & 38.3 \\ \hline$3,200,000 & 9.58% & $3,220,000 & 9.5 \\ \hline$8,300,000 & 24.85% & $8,340,000 & 24.7 \\ \hline$1,900,000 & 5.69% & $1,800,000 & 5.3 \\ \hline$50,000 & 0,15% & $50,000 & 0.1 \\ \hline$325,000 & 1.00% & $350,000 & 1.4 \\ \hline$33,400,000 & 4.49% & $1,600,000 & 4.7 \\ \hline \end{tabular} Income from Qperations $1,700,000 $840,000 Nonoperating Gains (Losses) Unrestrioted gitts and memorials Interest income Nonoperating Gains Net Ratio Calculations (Show your Work) Use the Metropolis Health System (MHS) comparative financial statements in the Examples and Quick Ratio ASSETSILIABILITIES Days Receivables Bperating Margin bee following tab M5A2 Ratios 'TIP SHEET' for assistance with Ratios 3. Ccmmon size the AMHS Sratement of Reyenve ano Expenses for each categorg. 8 Revenue Year 2 Common Sized Year 1 9 Net patient service revenue Dtherrevenue Total Dperating Revenue Expenses Nursing services Qther protessional services General services Support services Depreoiation Amortization Interest Provision for doubtful acoounts Total Expenses \begin{tabular}{|r|r|r|r|} \hline$5,025,000 & 15.04% & $5,450,000 & 16.1 \\ \hline$13,100,000 & 39.22% & $12,950,000 & 38.3 \\ \hline$3,200,000 & 9.58% & $3,220,000 & 9.5 \\ \hline$8,300,000 & 24.85% & $8,340,000 & 24.7 \\ \hline$1,900,000 & 5.69% & $1,800,000 & 5.3 \\ \hline$50,000 & 0,15% & $50,000 & 0.1 \\ \hline$325,000 & 1.00% & $350,000 & 1.4 \\ \hline$33,400,000 & 4.49% & $1,600,000 & 4.7 \\ \hline \end{tabular} Income from Qperations $1,700,000 $840,000 Nonoperating Gains (Losses) Unrestrioted gitts and memorials Interest income Nonoperating Gains Net Ratio Calculations (Show your Work) Use the Metropolis Health System (MHS) comparative financial statements in the Examples and Quick Ratio ASSETSILIABILITIES Days Receivables Bperating Margin bee following tab M5A2 Ratios 'TIP SHEET' for assistance with Ratios
Step by Step Solution
There are 3 Steps involved in it

Get step-by-step solutions from verified subject matter experts