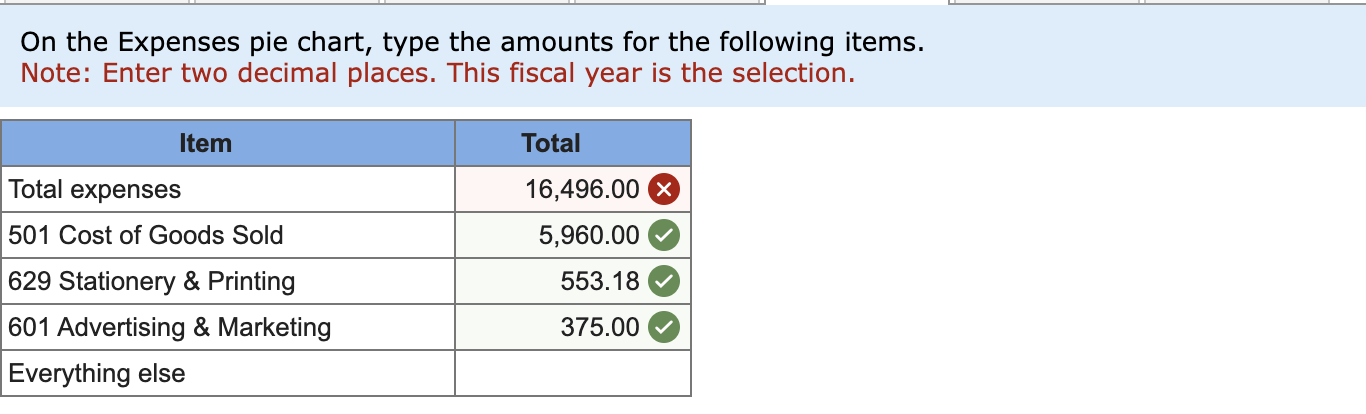
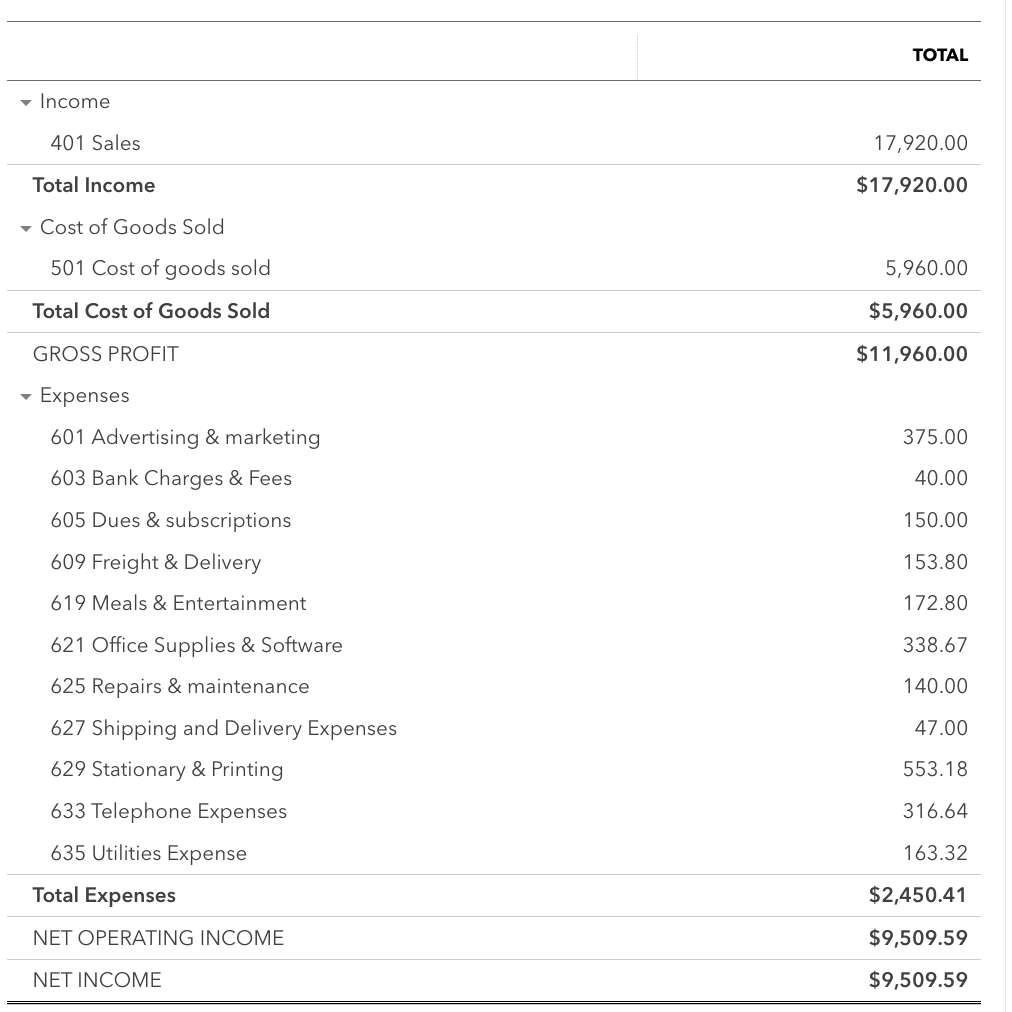
Question: On the Expenses pie chart, type the amounts for the following items. Note: Enter two decimal places. This fiscal year is the selection. Total expenses

On the Expenses pie chart, type the amounts forOn the Expenses pie chart, type the amounts for
On the Expenses pie chart, type the amounts for the following items. Note: Enter two decimal places. This fiscal year is the selection. Total expenses 16,496.00 501 Cost of Goods Sold 5,960.00 & 629 Stationery & Printing 553.18 Q 601 Advertising & Marketing 375.00 Q TOTAL ~ Income 401 Sales Total Income v Cost of Goods Sold 501 Cost of goods sold Total Cost of Goods Sold GROSS PROFIT ~ Expenses 601 Advertising & marketing 603 Bank Charges & Fees 605 Dues & subscriptions 609 Freight & Delivery 619 Meals & Entertainment 621 Office Supplies & Software 625 Repairs & maintenance 627 Shipping and Delivery Expenses 629 Stationary & Printing 633 Telephone Expenses 635 Utilities Expense Total Expenses NET OPERATING INCOME NET INCOME 17,920.00 $17,920.00 5,960.00 $5,960.00 $11,960.00 375.00 40.00 150.00 153.80 172.80 338.67 140.00 47.00 553.18 316.64 163.32 $2,450.41 $9,509.59 $9,509.59

Step by Step Solution

There are 3 Steps involved in it

1 Expert Approved Answer
Step: 1 Unlock blur-text-image
Question Has Been Solved by an Expert!

Get step-by-step solutions from verified subject matter experts

Step: 2 Unlock
Step: 3 Unlock

Students Have Also Explored These Related Accounting Questions!