

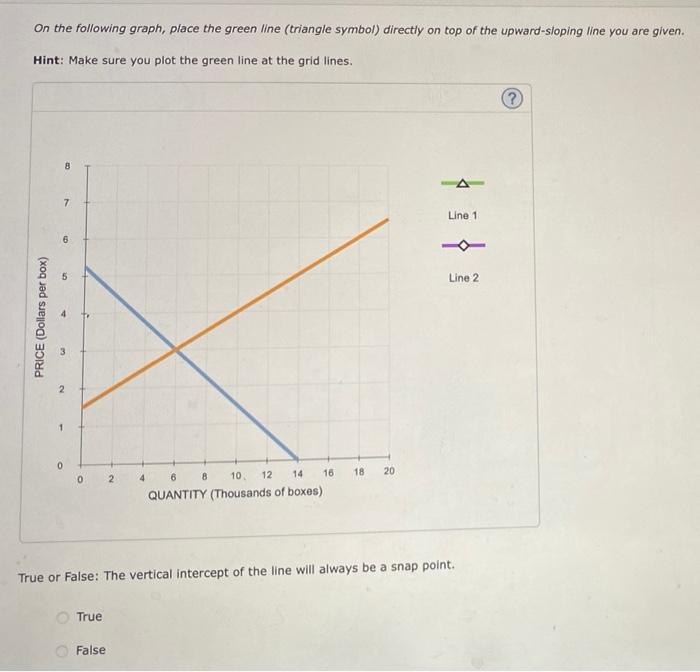
On the following graph, place the green line (triangle symbol) directly on top of the upward-sloping...
Fantastic news! We've Found the answer you've been seeking!
Question:
Expert Answer:
Above statement is wrong In this particular graph there are snap points on the original line at the ... View the full answer

Related Book For 

The Macro Economy Today
ISBN: 978-1259291821
14th edition
Authors: Bradley R. Schiller, Karen Gebhardt
Posted Date:
