

Question: On the graphs below, plot out the supply and demand curves based on the information given in the schedule. Find the equilibrium price for
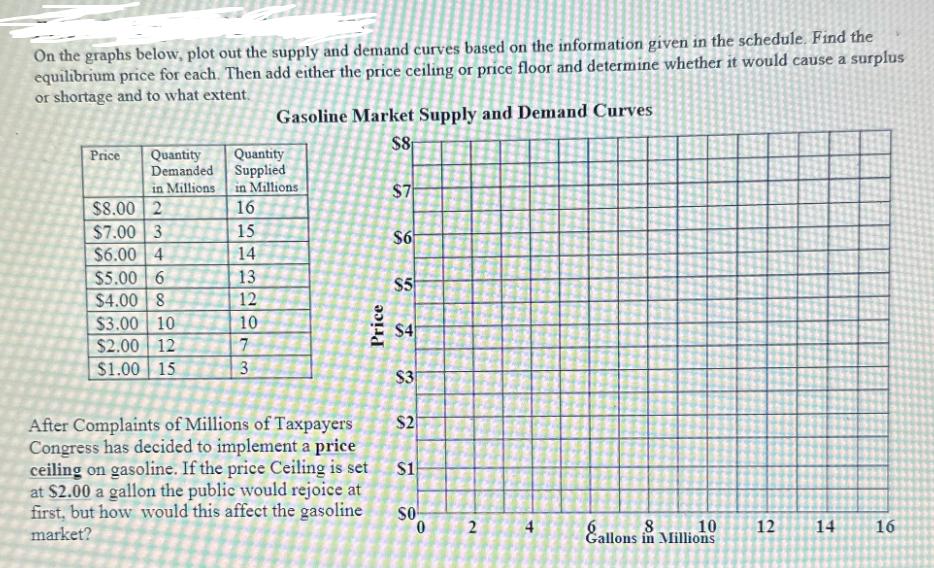
On the graphs below, plot out the supply and demand curves based on the information given in the schedule. Find the equilibrium price for each. Then add either the price ceiling or price floor and determine whether it would cause a surplus or shortage and to what extent. Price Quantity Demanded in Millions $8.00 2 $7.00 3 $6.00 4 $5.00 6 $4.00 8 $3.00 10 $2.00 12 $1.00 15 Quantity Supplied in Millions 16 15 14 13 12 Gasoline Market Supply and Demand Curves $8 10 7 3 After Complaints of Millions of Taxpayers Congress has decided to implement a price ceiling on gasoline. If the price Ceiling is set at $2.00 a gallon the public would rejoice at first, but how would this affect the gasoline market? Price $7 S6 $5 $4 $3 $2 $1 SO 0 2 4 Sallons in Millions 12 14 16
Step by Step Solution
There are 3 Steps involved in it
Gasoline Market Supply and Demand Curves At a price of 8 quantity demanded is 2 million gallons and ... View full answer

Get step-by-step solutions from verified subject matter experts